| Red | Green | Blue | |
| z | 17.64 | ||
| znorm | Inf | ||
| sky | -Inf | -Inf | -NaN |
| S/N | 33.4 | 53.8 | 64.1 |
| S/N(c) | 45.2 | 76.9 | 52.3 |
| SN(E/C) |
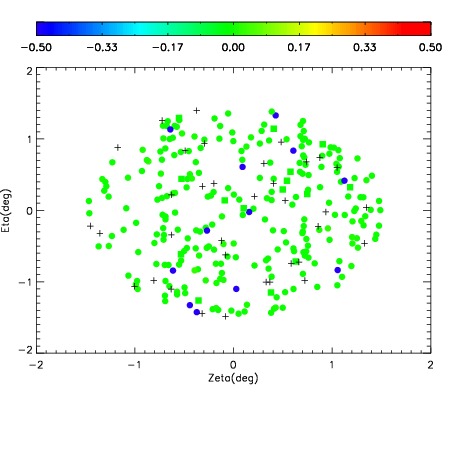
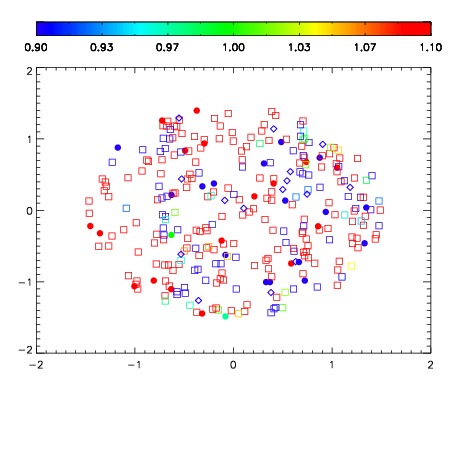
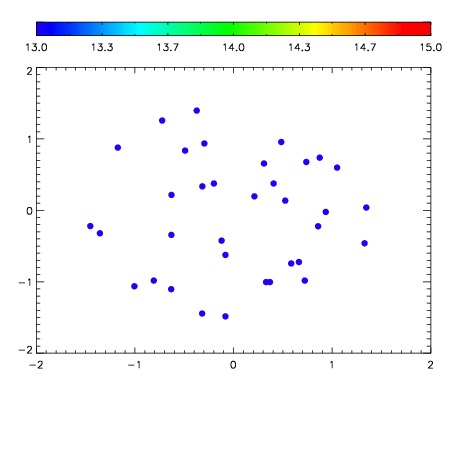

| Frame | Nreads | Zeropoints | Mag plots | Spatial mag deviation | Spatial sky 16325A emission deviations (filled: sky, open: star) | Spatial sky continuum emission | Spatial sky telluric CO2 absorption deviations (filled: H < 10) | |||||||||||||||||||||||
| 0 | 0 |
|
|
|
|
|
|
| IPAIR | NAME | SHIFT | NEWSHIFT | S/N | NAME | SHIFT | NEWSHIFT | S/N |
| 0 | 19030042 | 0.508312 | 0.00000 | 18.8529 | 19030044 | 0.000211070 | 0.508101 | 18.7945 |
| 1 | 19030041 | 0.507444 | 0.000867963 | 18.9088 | 19030043 | 0.000523554 | 0.507788 | 18.8590 |
| 2 | 19030045 | 0.506228 | 0.00208396 | 18.8902 | 19030040 | 0.00000 | 0.508312 | 18.8394 |
| 3 | 19030049 | 0.504999 | 0.00331300 | 18.8101 | 19030047 | 0.00284499 | 0.505467 | 18.7759 |
| 4 | 19030046 | 0.506116 | 0.00219601 | 18.8061 | 19030048 | 0.00261563 | 0.505696 | 18.7599 |