| Red | Green | Blue | |
| z | 17.64 | ||
| znorm | Inf | ||
| sky | -Inf | -NaN | -NaN |
| S/N | 35.3 | 54.7 | 63.4 |
| S/N(c) | 42.8 | 0.8 | 0.9 |
| SN(E/C) |

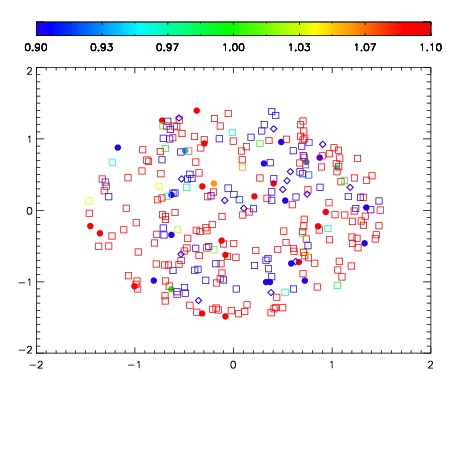
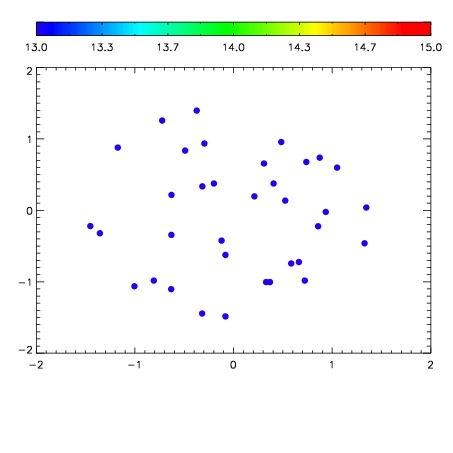

| Frame | Nreads | Zeropoints | Mag plots | Spatial mag deviation | Spatial sky 16325A emission deviations (filled: sky, open: star) | Spatial sky continuum emission | Spatial sky telluric CO2 absorption deviations (filled: H < 10) | |||||||||||||||||||||||
| 0 | 0 |
|
|
|
|
|
|
| IPAIR | NAME | SHIFT | NEWSHIFT | S/N | NAME | SHIFT | NEWSHIFT | S/N |
| 0 | 19060042 | 0.504812 | 0.00000 | 18.8108 | 19060040 | 0.00212087 | 0.502691 | 18.8297 |
| 1 | 19060038 | 0.503595 | 0.00121701 | 18.8337 | 19060039 | 0.00154305 | 0.503269 | 18.8901 |
| 2 | 19060037 | 0.503060 | 0.00175202 | 18.8267 | 19060036 | 0.00000 | 0.504812 | 18.8764 |
| 3 | 19060041 | 0.503537 | 0.00127500 | 18.8131 | 19060043 | 0.00260637 | 0.502206 | 18.8525 |