| Red | Green | Blue | |
| z | 17.64 | ||
| znorm | Inf | ||
| sky | -Inf | -Inf | -NaN |
| S/N | 32.4 | 51.3 | 59.6 |
| S/N(c) | 51.2 | 44.6 | 73.7 |
| SN(E/C) |
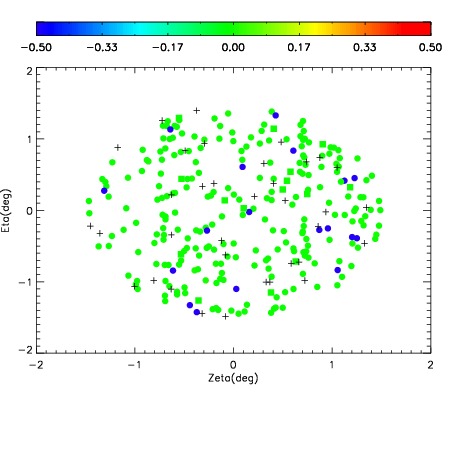
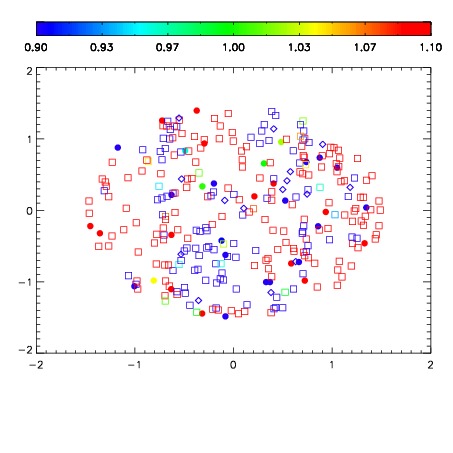
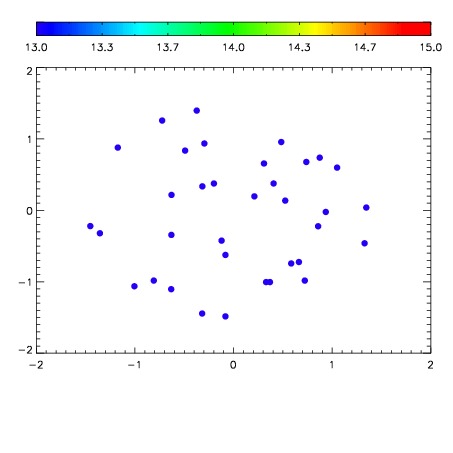

| Frame | Nreads | Zeropoints | Mag plots | Spatial mag deviation | Spatial sky 16325A emission deviations (filled: sky, open: star) | Spatial sky continuum emission | Spatial sky telluric CO2 absorption deviations (filled: H < 10) | |||||||||||||||||||||||
| 0 | 0 |
|
|
|
|
|
|
| IPAIR | NAME | SHIFT | NEWSHIFT | S/N | NAME | SHIFT | NEWSHIFT | S/N |
| 0 | 19100045 | 0.00466647 | 0.00000 | 18.9525 | 19100046 | -0.500837 | 0.505503 | 18.9726 |
| 1 | 19100041 | 0.00000 | 0.00466647 | 19.0018 | 19100043 | -0.500639 | 0.505305 | 19.0067 |
| 2 | 19100044 | 0.00452477 | 0.000141700 | 18.9980 | 19100042 | -0.500470 | 0.505136 | 18.9841 |
| 3 | 19100048 | 0.00252422 | 0.00214225 | 18.9732 | 19100047 | -0.501164 | 0.505830 | 18.9777 |