| Red | Green | Blue | |
| z | 17.63 | ||
| znorm | Inf | ||
| sky | -Inf | -NaN | -NaN |
| S/N | 34.6 | 53.7 | 63.1 |
| S/N(c) | 52.3 | 44.7 | 71.2 |
| SN(E/C) |
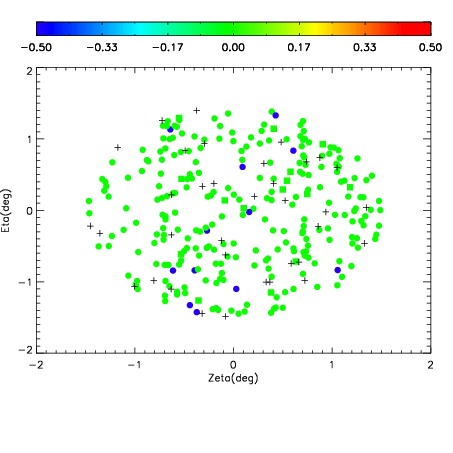
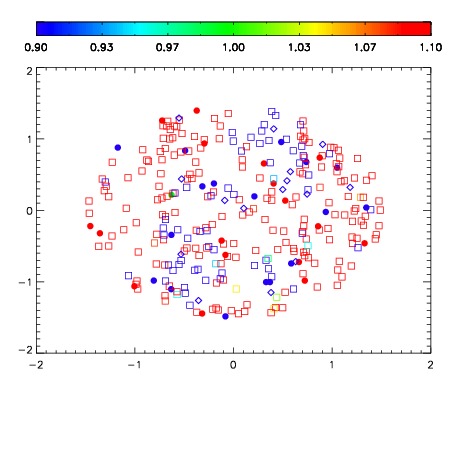
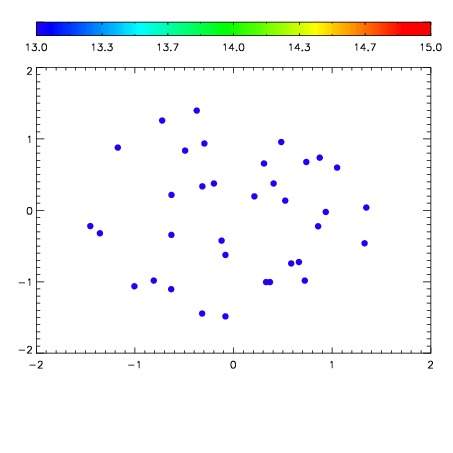

| Frame | Nreads | Zeropoints | Mag plots | Spatial mag deviation | Spatial sky 16325A emission deviations (filled: sky, open: star) | Spatial sky continuum emission | Spatial sky telluric CO2 absorption deviations (filled: H < 10) | |||||||||||||||||||||||
| 0 | 0 |
|
|
|
|
|
|
| IPAIR | NAME | SHIFT | NEWSHIFT | S/N | NAME | SHIFT | NEWSHIFT | S/N |
| 0 | 19300034 | 0.504389 | 0.00000 | 19.0078 | 19300035 | 0.00162117 | 0.502768 | 19.0126 |
| 1 | 19300033 | 0.503482 | 0.000907004 | 18.9765 | 19300031 | 0.000694814 | 0.503694 | 18.9842 |
| 2 | 19300029 | 0.502781 | 0.00160801 | 18.9223 | 19300032 | 0.000678457 | 0.503711 | 18.9557 |
| 3 | 19300030 | 0.502307 | 0.00208199 | 18.9007 | 19300028 | 0.00000 | 0.504389 | 18.8289 |