| Red | Green | Blue | |
| z | 17.64 | ||
| znorm | Inf | ||
| sky | -Inf | -NaN | -Inf |
| S/N | 41.6 | 66.8 | 78.0 |
| S/N(c) | 0.8 | 60.7 | 66.9 |
| SN(E/C) |
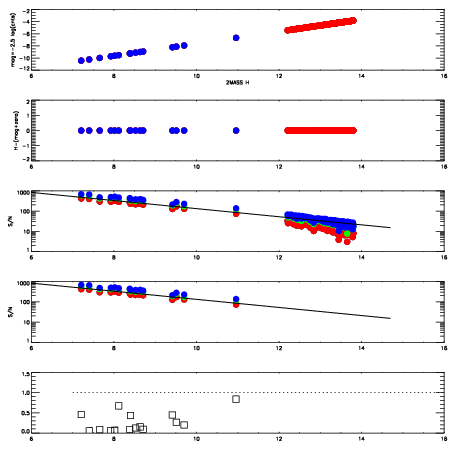
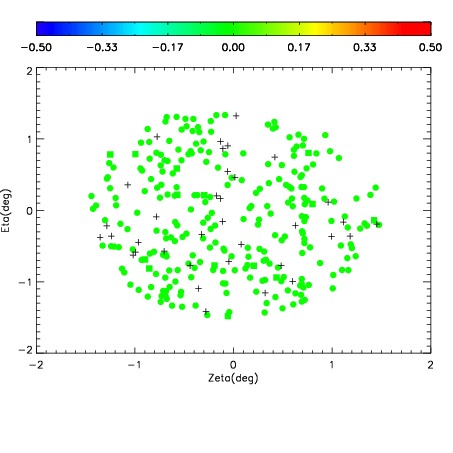
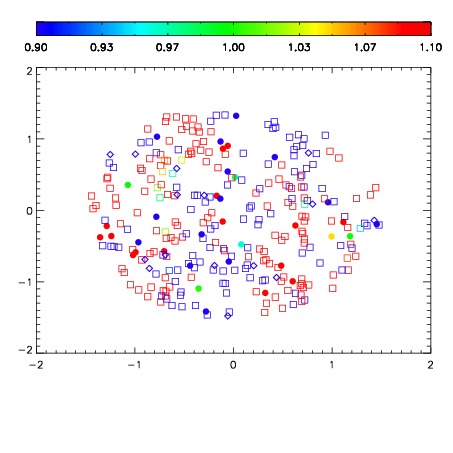
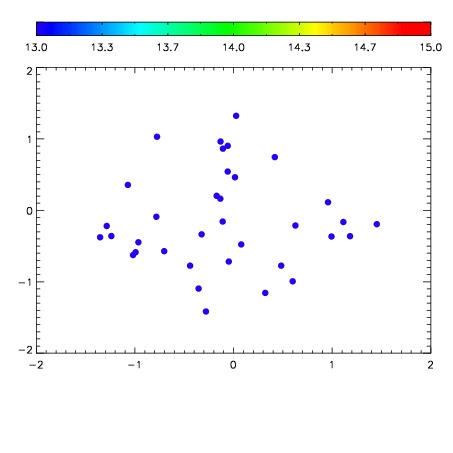

| Frame | Nreads | Zeropoints | Mag plots | Spatial mag deviation | Spatial sky 16325A emission deviations (filled: sky, open: star) | Spatial sky continuum emission | Spatial sky telluric CO2 absorption deviations (filled: H < 10) | |||||||||||||||||||||||
| 0 | 0 |
|
|
|
|
|
|
| IPAIR | NAME | SHIFT | NEWSHIFT | S/N | NAME | SHIFT | NEWSHIFT | S/N |
| 0 | 18760050 | 0.504532 | 0.00000 | 19.1389 | 18760055 | 0.000483988 | 0.504048 | 19.1743 |
| 1 | 18760057 | 0.503411 | 0.00112098 | 19.1705 | 18760056 | 3.35031e-05 | 0.504498 | 19.1882 |
| 2 | 18760054 | 0.503759 | 0.000772953 | 19.1353 | 18760052 | -6.14206e-05 | 0.504593 | 19.1374 |
| 3 | 18760053 | 0.503502 | 0.00102997 | 19.1137 | 18760051 | 0.000140914 | 0.504391 | 19.1366 |
| 4 | 18760049 | 0.503937 | 0.000594974 | 19.1075 | 18760048 | 0.00000 | 0.504532 | 19.1080 |