| Red | Green | Blue | |
| z | 17.64 | ||
| znorm | Inf | ||
| sky | -Inf | -Inf | -NaN |
| S/N | 34.4 | 50.6 | 64.9 |
| S/N(c) | 37.2 | 56.3 | 54.2 |
| SN(E/C) |
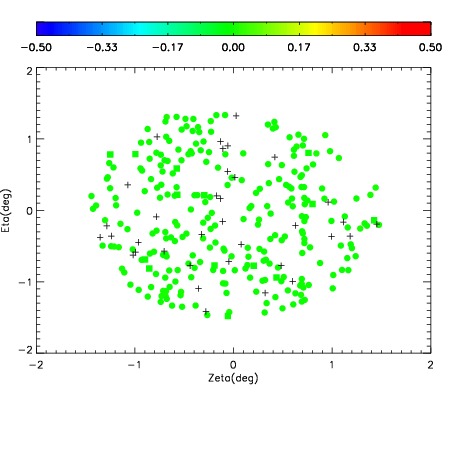
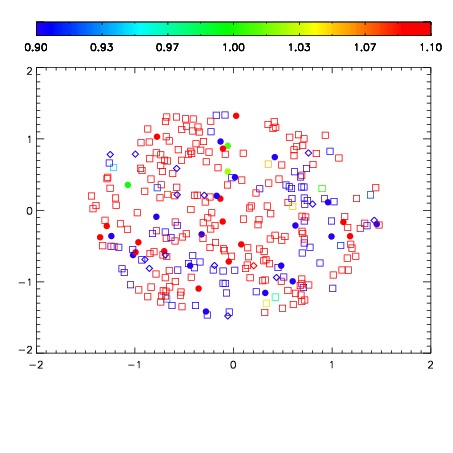
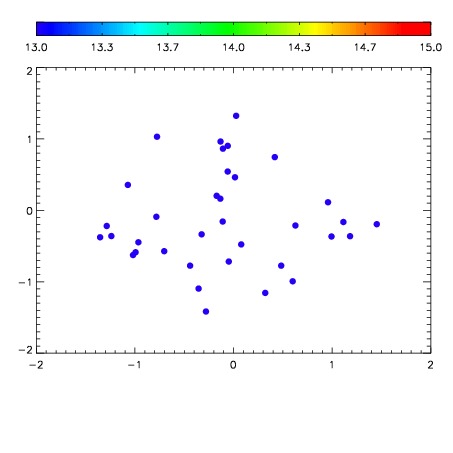

| Frame | Nreads | Zeropoints | Mag plots | Spatial mag deviation | Spatial sky 16325A emission deviations (filled: sky, open: star) | Spatial sky continuum emission | Spatial sky telluric CO2 absorption deviations (filled: H < 10) | |||||||||||||||||||||||
| 0 | 0 |
|
|
|
|
|
|
| IPAIR | NAME | SHIFT | NEWSHIFT | S/N | NAME | SHIFT | NEWSHIFT | S/N |
| 0 | 18840073 | 0.00000 | 0.00000 | 19.0923 | 18840074 | -0.510963 | 0.510963 | 19.1150 |
| 1 | 18840080 | -0.00442281 | 0.00442281 | 19.1844 | 18840078 | -0.511319 | 0.511319 | 19.1820 |
| 2 | 18840077 | -0.00315308 | 0.00315308 | 19.1749 | 18840079 | -0.511798 | 0.511798 | 19.1762 |
| 3 | 18840076 | -0.00347974 | 0.00347974 | 19.1359 | 18840075 | -0.511409 | 0.511409 | 19.1694 |