| Red | Green | Blue | |
| z | 17.65 | ||
| znorm | Inf | ||
| sky | -Inf | -Inf | -Inf |
| S/N | 36.6 | 57.6 | 66.2 |
| S/N(c) | 30.4 | 49.0 | 60.4 |
| SN(E/C) |
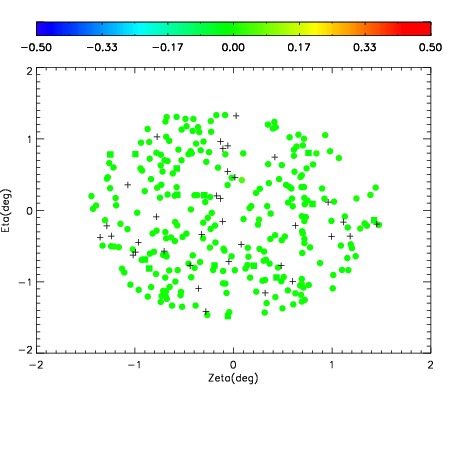
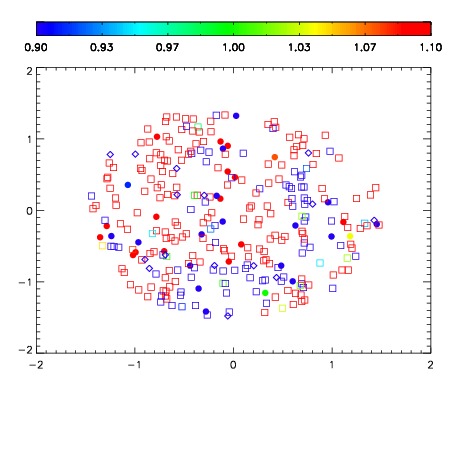
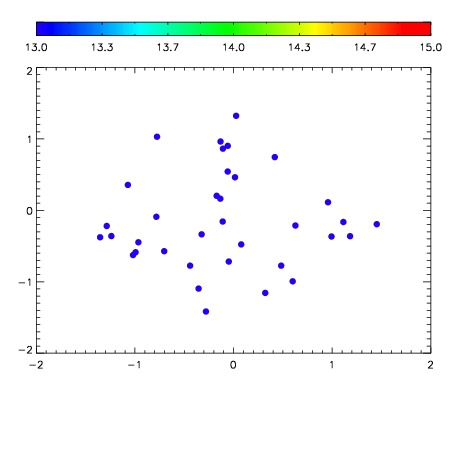

| Frame | Nreads | Zeropoints | Mag plots | Spatial mag deviation | Spatial sky 16325A emission deviations (filled: sky, open: star) | Spatial sky continuum emission | Spatial sky telluric CO2 absorption deviations (filled: H < 10) | |||||||||||||||||||||||
| 0 | 0 |
|
|
|
|
|
|
| IPAIR | NAME | SHIFT | NEWSHIFT | S/N | NAME | SHIFT | NEWSHIFT | S/N |
| 0 | 18860078 | 0.00000 | 0.00000 | 18.9449 | 18860079 | -0.512998 | 0.512998 | 18.9599 |
| 1 | 18860085 | -0.00204235 | 0.00204235 | 19.0709 | 18860083 | -0.512399 | 0.512399 | 19.0658 |
| 2 | 18860082 | -0.000144255 | 0.000144255 | 18.9947 | 18860084 | -0.512840 | 0.512840 | 19.0516 |
| 3 | 18860081 | -0.000475913 | 0.000475913 | 18.9926 | 18860080 | -0.513198 | 0.513198 | 18.9612 |