| Red | Green | Blue | |
| z | 17.64 | ||
| znorm | Inf | ||
| sky | -Inf | -Inf | -NaN |
| S/N | 42.8 | 58.2 | 70.5 |
| S/N(c) | 0.0 | 0.0 | 0.0 |
| SN(E/C) |
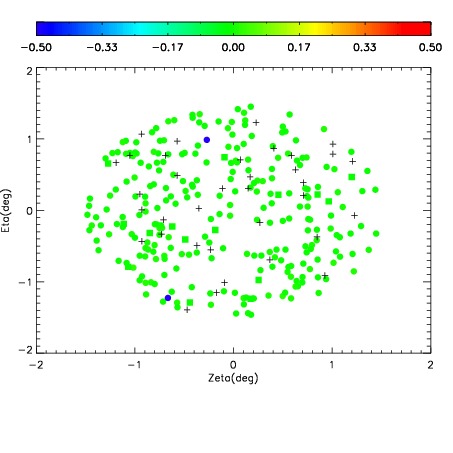
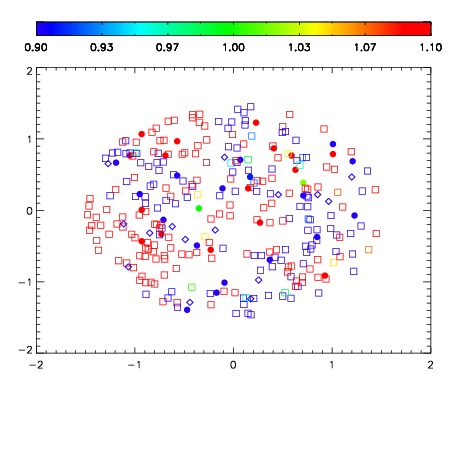
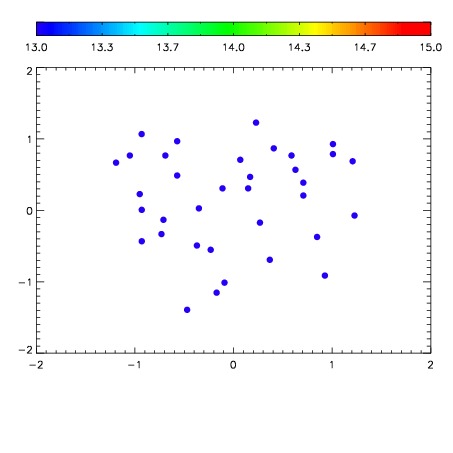

| Frame | Nreads | Zeropoints | Mag plots | Spatial mag deviation | Spatial sky 16325A emission deviations (filled: sky, open: star) | Spatial sky continuum emission | Spatial sky telluric CO2 absorption deviations (filled: H < 10) | |||||||||||||||||||||||
| 0 | 0 |
|
|
|
|
|
|
| IPAIR | NAME | SHIFT | NEWSHIFT | S/N | NAME | SHIFT | NEWSHIFT | S/N |
| 0 | 18850024 | 0.512912 | 0.00000 | 19.6797 | 18850022 | 0.00358400 | 0.509328 | 19.8749 |
| 1 | 18850021 | 0.512370 | 0.000541985 | 19.8932 | 18850023 | 0.00446059 | 0.508451 | 19.9142 |
| 2 | 18850020 | 0.510295 | 0.00261700 | 19.8878 | 18850019 | 0.00000 | 0.512912 | 19.8794 |