| Red | Green | Blue | |
| z | 17.64 | ||
| znorm | 12.71 | ||
| sky | 20.9 | 21.3 | -NaN |
| S/N | 18.5 | 28.4 | 35.9 |
| S/N(c) | 0.0 | 0.0 | 0.0 |
| SN(E/C) |
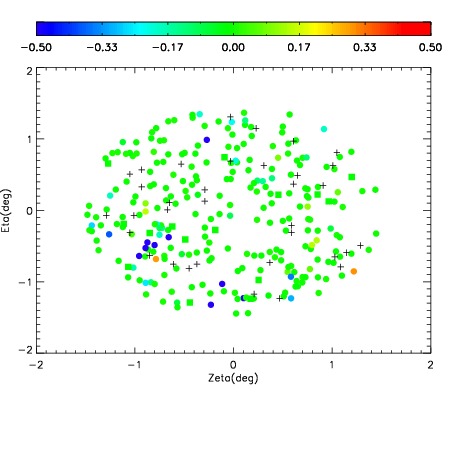

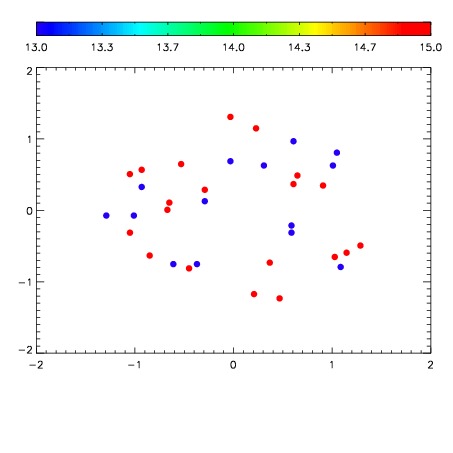

| Frame | Nreads | Zeropoints | Mag plots | Spatial mag deviation | Spatial sky 16325A emission deviations (filled: sky, open: star) | Spatial sky continuum emission | Spatial sky telluric CO2 absorption deviations (filled: H < 10) | |||||||||||||||||||||||
| 0 | 94 |
|
|
|
|
|
|
| IPAIR | NAME | SHIFT | NEWSHIFT | S/N | NAME | SHIFT | NEWSHIFT | S/N |
| 0 | 19120039 | 0.00000 | 0.00000 | 19.5415 | 19120040 | -0.492494 | 0.492494 | 19.4504 |