| Red | Green | Blue | |
| z | 17.63 | ||
| znorm | Inf | ||
| sky | -NaN | -NaN | -NaN |
| S/N | 29.6 | 43.9 | 51.8 |
| S/N(c) | 0.0 | 0.0 | 0.0 |
| SN(E/C) |
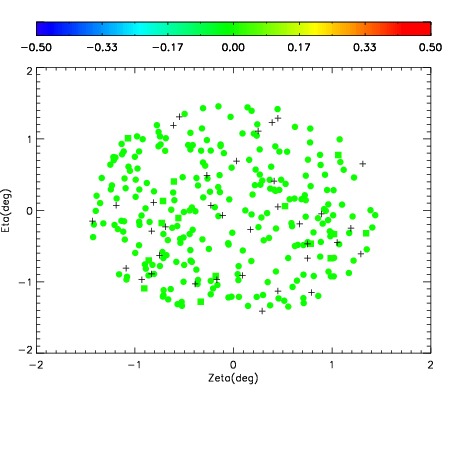
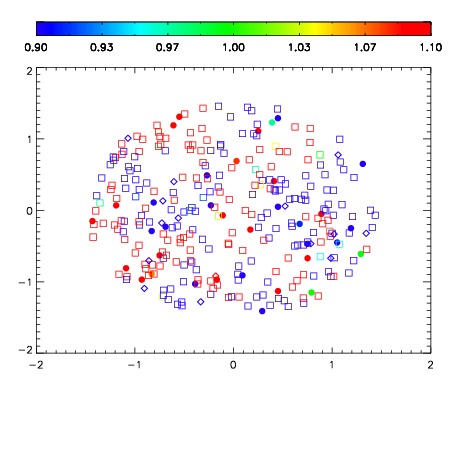
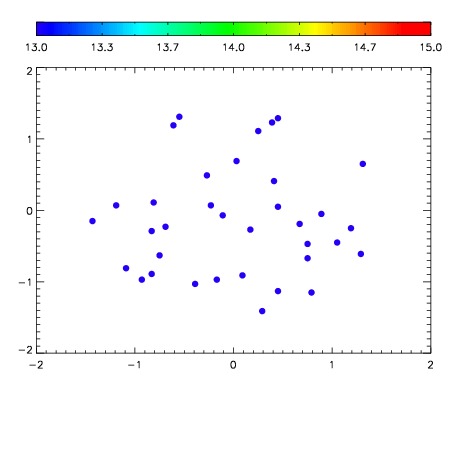

| Frame | Nreads | Zeropoints | Mag plots | Spatial mag deviation | Spatial sky 16325A emission deviations (filled: sky, open: star) | Spatial sky continuum emission | Spatial sky telluric CO2 absorption deviations (filled: H < 10) | |||||||||||||||||||||||
| 0 | 0 |
|
|
|
|
|
|
| IPAIR | NAME | SHIFT | NEWSHIFT | S/N | NAME | SHIFT | NEWSHIFT | S/N |
| 0 | 19060016 | 0.505289 | 0.00000 | 19.3829 | 19060015 | 0.000771726 | 0.504517 | 19.5443 |
| 1 | 19060013 | 0.503947 | 0.00134200 | 19.4661 | 19060014 | 0.000125343 | 0.505164 | 19.5669 |
| 2 | 19060012 | 0.503383 | 0.00190604 | 19.3737 | 19060011 | 0.00000 | 0.505289 | 19.2372 |