| Red | Green | Blue | |
| z | 17.64 | ||
| znorm | Inf | ||
| sky | -NaN | -NaN | -NaN |
| S/N | 41.3 | 63.3 | 71.9 |
| S/N(c) | 0.0 | 0.0 | 0.0 |
| SN(E/C) |
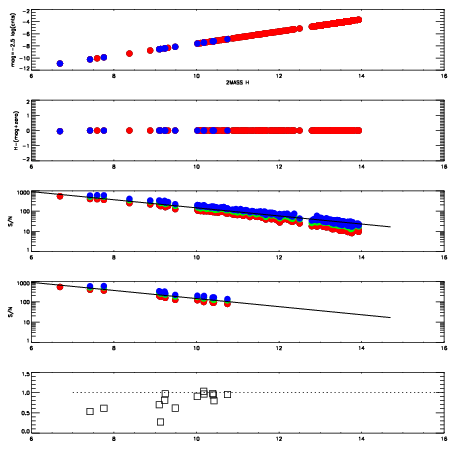
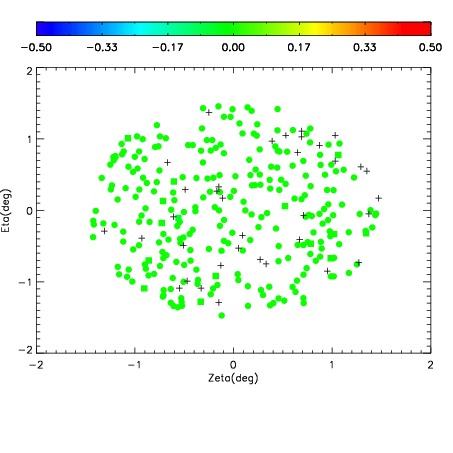
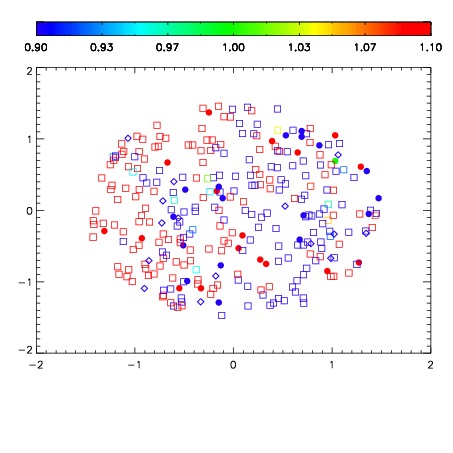
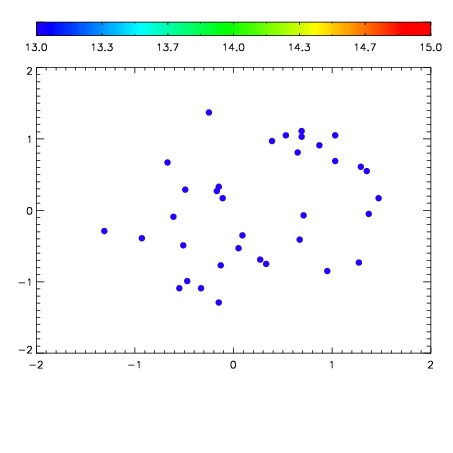

| Frame | Nreads | Zeropoints | Mag plots | Spatial mag deviation | Spatial sky 16325A emission deviations (filled: sky, open: star) | Spatial sky continuum emission | Spatial sky telluric CO2 absorption deviations (filled: H < 10) | |||||||||||||||||||||||
| 0 | 0 |
|
|
|
|
|
|
| IPAIR | NAME | SHIFT | NEWSHIFT | S/N | NAME | SHIFT | NEWSHIFT | S/N |
| 0 | 19040024 | 0.502967 | 0.00000 | 19.7132 | 19040025 | -0.00436538 | 0.507332 | 19.7538 |
| 1 | 19040027 | 0.499258 | 0.00370899 | 19.7481 | 19040026 | -0.00465361 | 0.507621 | 19.7706 |
| 2 | 19040023 | 0.501603 | 0.00136399 | 19.6850 | 19040022 | 0.00000 | 0.502967 | 19.6771 |