| Red | Green | Blue | |
| z | 17.64 | ||
| znorm | 12.71 | ||
| sky | 22.1 | -NaN | 23.3 |
| S/N | 25.6 | 37.7 | 42.6 |
| S/N(c) | 0.0 | 0.0 | 0.0 |
| SN(E/C) |
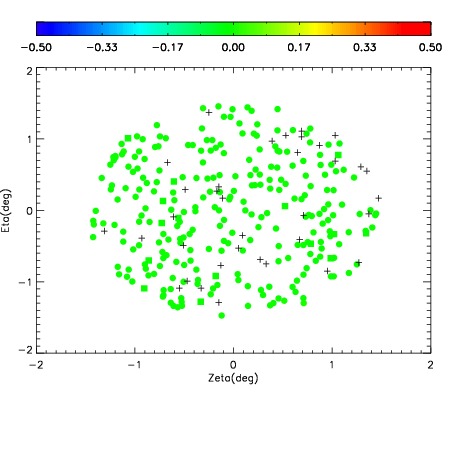
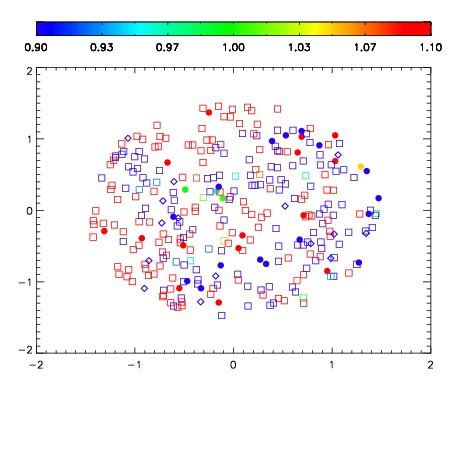
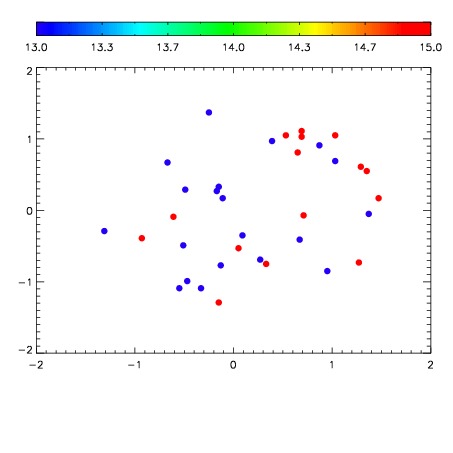

| Frame | Nreads | Zeropoints | Mag plots | Spatial mag deviation | Spatial sky 16325A emission deviations (filled: sky, open: star) | Spatial sky continuum emission | Spatial sky telluric CO2 absorption deviations (filled: H < 10) | |||||||||||||||||||||||
| 0 | 94 |
|
|
|
|
|
|
| IPAIR | NAME | SHIFT | NEWSHIFT | S/N | NAME | SHIFT | NEWSHIFT | S/N |
| 0 | 19100012 | 0.503583 | 0.00000 | 19.8473 | 19100011 | 0.00000 | 0.503583 | 19.8636 |