| Red | Green | Blue | |
| z | 17.64 | ||
| znorm | Inf | ||
| sky | -Inf | -Inf | -NaN |
| S/N | 34.0 | 52.0 | 60.5 |
| S/N(c) | 36.4 | 29.4 | 91.3 |
| SN(E/C) |
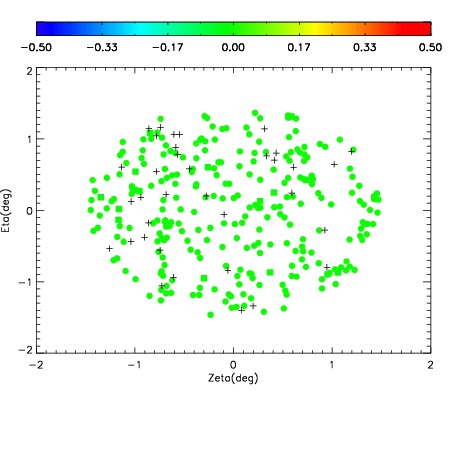
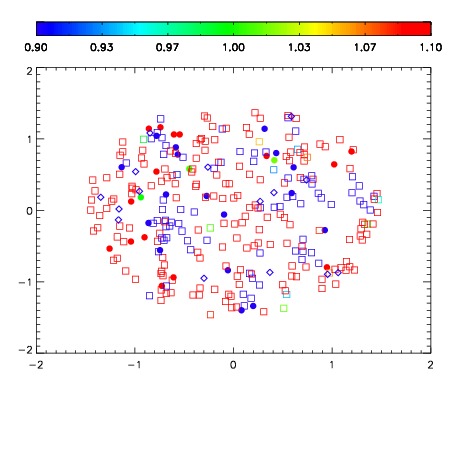
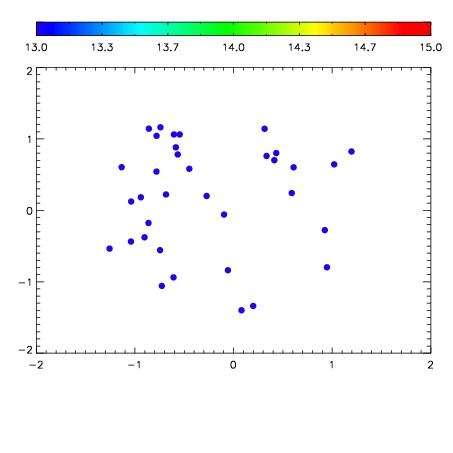

| Frame | Nreads | Zeropoints | Mag plots | Spatial mag deviation | Spatial sky 16325A emission deviations (filled: sky, open: star) | Spatial sky continuum emission | Spatial sky telluric CO2 absorption deviations (filled: H < 10) | |||||||||||||||||||||||
| 0 | 0 |
|
|
|
|
|
|
| IPAIR | NAME | SHIFT | NEWSHIFT | S/N | NAME | SHIFT | NEWSHIFT | S/N |
| 0 | 18720050 | 0.00162444 | 0.00000 | 18.9365 | 18720052 | -0.506827 | 0.508451 | 19.0176 |
| 1 | 18720049 | 0.000361271 | 0.00126317 | 18.9480 | 18720051 | -0.506491 | 0.508115 | 19.0226 |
| 2 | 18720053 | 0.00134747 | 0.000276970 | 18.9261 | 18720048 | -0.507866 | 0.509490 | 18.8660 |
| 3 | 18720046 | 0.00000 | 0.00162444 | 18.7984 | 18720047 | -0.506688 | 0.508312 | 18.8287 |