| Frame | Nreads | Zeropoints | Mag plots
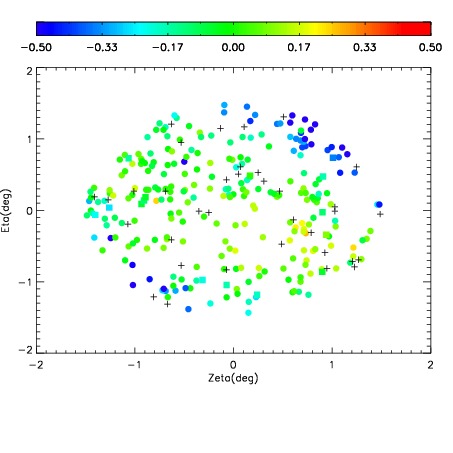
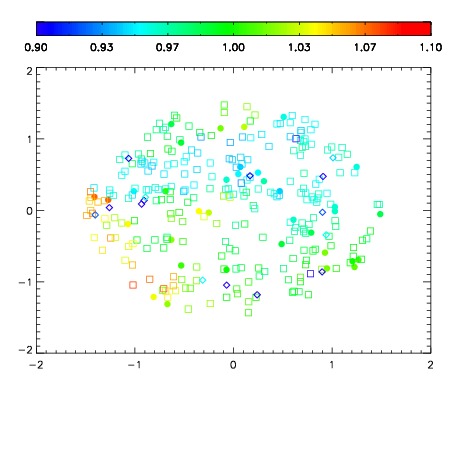
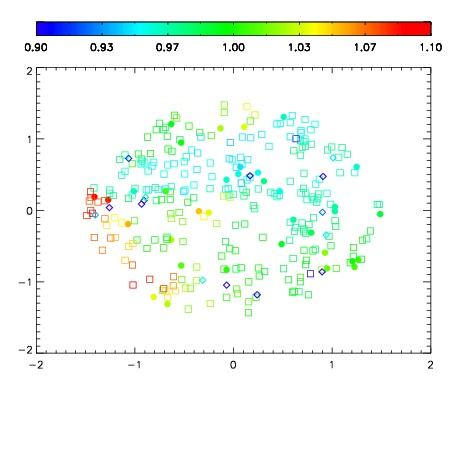
| Spatial mag deviation
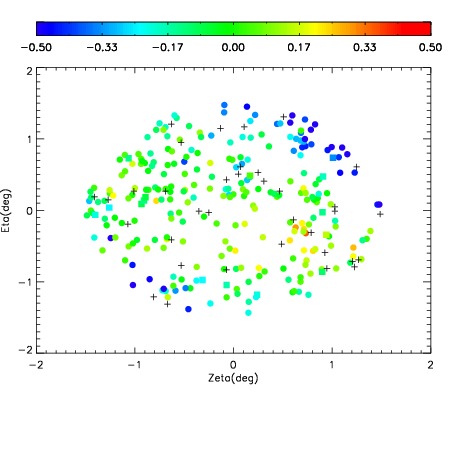
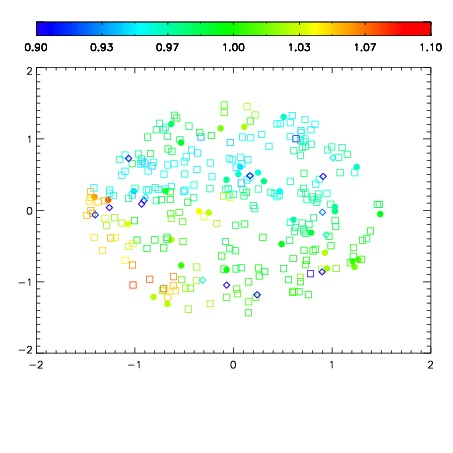
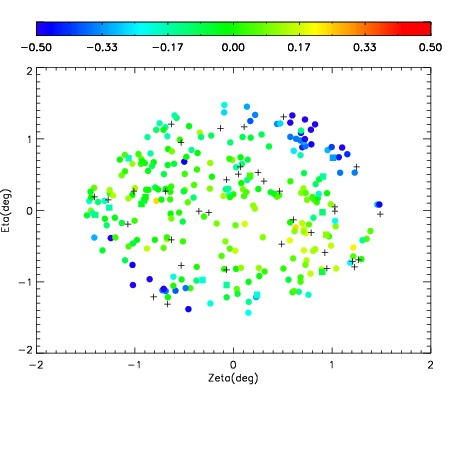
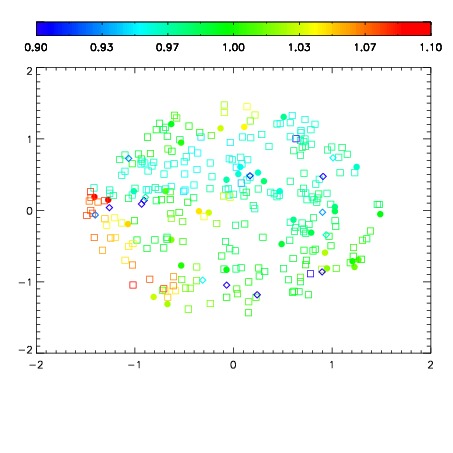
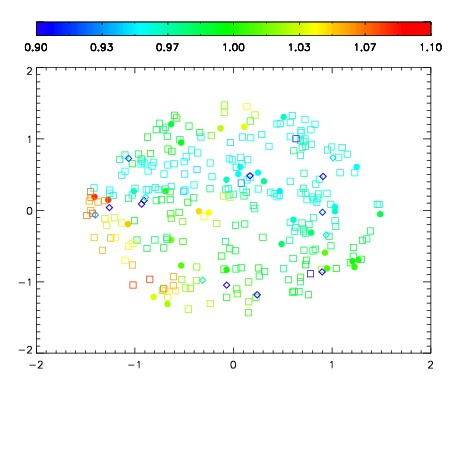
| Spatial sky 16325A emission deviations (filled: sky, open: star)
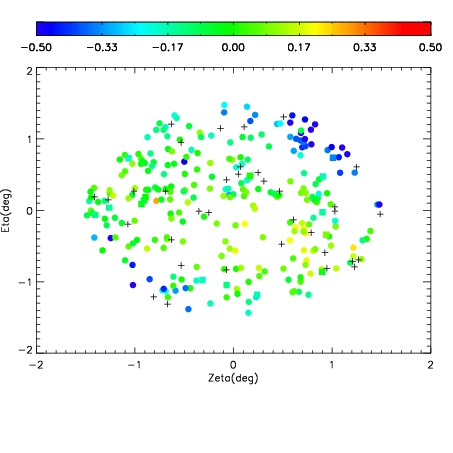
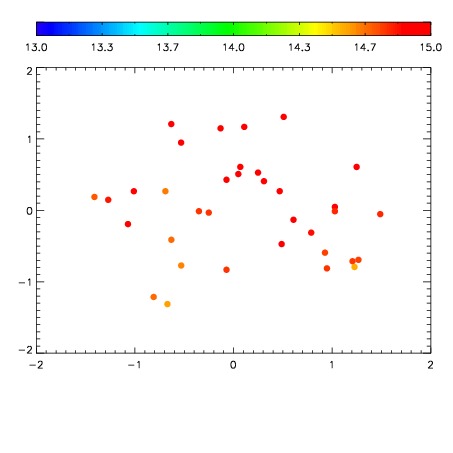
| Spatial sky continuum emission
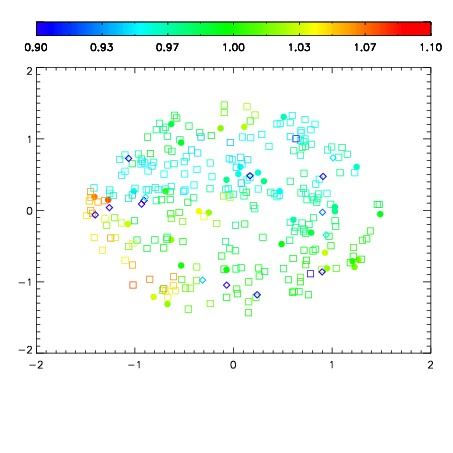
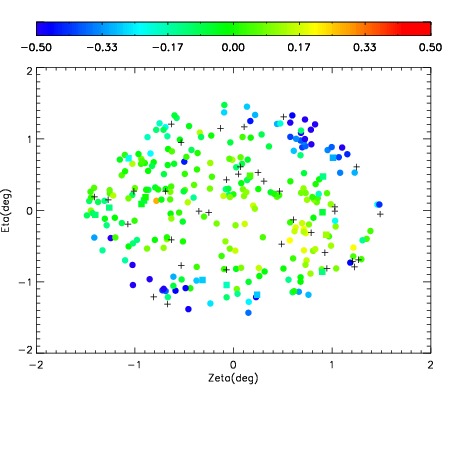
| Spatial sky telluric CO2 absorption deviations (filled: H < 10)
|
| 18850039
| 47
| | Red | Green | Blue
| | z | | 18.97
| | znorm | | 14.79
| | sky | 15.1 | 14.6 | 14.9
| | S/N | 18.5 | 28.4 | 33.3
| | S/N(c) | 18.6 | 48.5 | 0.4
| | SN(E/C) 0.41
|
| 
| 
| 
| 
| 
|
| 18850040
| 47
| | Red | Green | Blue
| | z | | 19.05
| | znorm | | 14.87
| | sky | 15.1 | 14.9 | 14.9
| | S/N | 18.2 | 28.2 | 33.2
| | S/N(c) | 19.2 | 51.3 | 0.4
| | SN(E/C) 0.42
|
| 
| 
| 
| 
| 
|
| 18850041
| 47
| | Red | Green | Blue
| | z | | 19.02
| | znorm | | 14.84
| | sky | 15.2 | 14.9 | 15.0
| | S/N | 18.4 | 28.3 | 33.3
| | S/N(c) | 19.2 | 50.6 | 0.4
| | SN(E/C) 0.41
|
| 
| 
| 
| 
| 
|
| 18850042
| 47
| | Red | Green | Blue
| | z | | 19.02
| | znorm | | 14.84
| | sky | 15.1 | 14.8 | 14.8
| | S/N | 18.3 | 28.2 | 33.1
| | S/N(c) | 19.0 | 51.6 | 0.4
| | SN(E/C) 0.41
|
| 
| 
| 
| 
| 
|
| 18850043
| 47
| | Red | Green | Blue
| | z | | 19.07
| | znorm | | 14.89
| | sky | 15.1 | 14.8 | 14.8
| | S/N | 18.9 | 29.2 | 34.4
| | S/N(c) | 19.7 | 52.8 | 0.4
| | SN(E/C) 0.40
|
| 
| 
| 
| 
| 
|
| 18850044
| 47
| | Red | Green | Blue
| | z | | 19.05
| | znorm | | 14.87
| | sky | 15.1 | 14.9 | 14.7
| | S/N | 18.8 | 28.9 | 33.9
| | S/N(c) | 19.9 | 51.9 | 0.4
| | SN(E/C) 0.41
|
| 
| 
| 
| 
| 
|
| 18850045
| 47
| | Red | Green | Blue
| | z | | 19.10
| | znorm | | 14.92
| | sky | 15.1 | 14.8 | 14.7
| | S/N | 19.2 | 29.5 | 34.8
| | S/N(c) | 20.2 | 54.2 | 0.4
| | SN(E/C) 0.37
|
| 
| 
| 
| 
| 
|
| 18850046
| 47
| | Red | Green | Blue
| | z | | 19.11
| | znorm | | 14.93
| | sky | 15.0 | 14.8 | 14.7
| | S/N | 19.5 | 30.0 | 35.3
| | S/N(c) | 20.4 | 54.2 | 0.4
| | SN(E/C) 0.45
|
| 
| 
| 
| 
| 
|