| Red | Green | Blue | |
| z | 17.64 | ||
| znorm | Inf | ||
| sky | -Inf | -NaN | -Inf |
| S/N | 34.2 | 55.1 | 65.2 |
| S/N(c) | 39.1 | 103.8 | 0.8 |
| SN(E/C) |


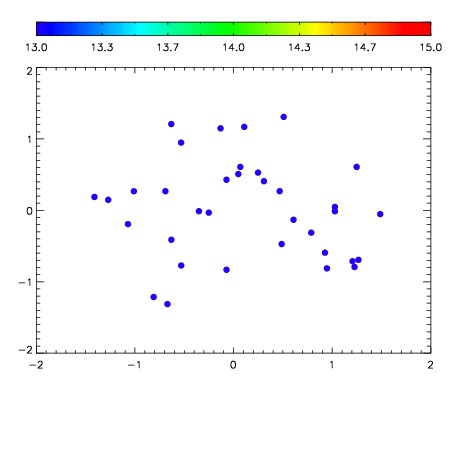

| Frame | Nreads | Zeropoints | Mag plots | Spatial mag deviation | Spatial sky 16325A emission deviations (filled: sky, open: star) | Spatial sky continuum emission | Spatial sky telluric CO2 absorption deviations (filled: H < 10) | |||||||||||||||||||||||
| 0 | 0 |
|
|
|
|
|
|
| IPAIR | NAME | SHIFT | NEWSHIFT | S/N | NAME | SHIFT | NEWSHIFT | S/N |
| 0 | 18850039 | 0.00000 | 0.00000 | 18.9672 | 18850041 | -0.510875 | 0.510875 | 19.0011 |
| 1 | 18850046 | -0.00106106 | 0.00106106 | 19.1127 | 18850045 | -0.509198 | 0.509198 | 19.1014 |
| 2 | 18850043 | -0.00372290 | 0.00372290 | 19.0680 | 18850044 | -0.509244 | 0.509244 | 19.0412 |
| 3 | 18850042 | -0.00401482 | 0.00401482 | 19.0104 | 18850040 | -0.511298 | 0.511298 | 19.0364 |