| Red | Green | Blue | |
| z | 17.64 | ||
| znorm | Inf | ||
| sky | -Inf | -NaN | -NaN |
| S/N | 33.4 | 51.6 | 60.2 |
| S/N(c) | 39.3 | 0.6 | 87.4 |
| SN(E/C) |

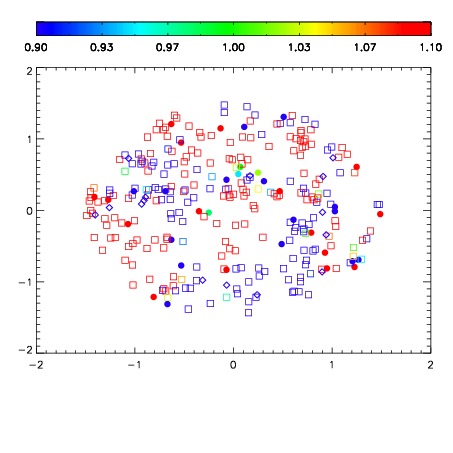


| Frame | Nreads | Zeropoints | Mag plots | Spatial mag deviation | Spatial sky 16325A emission deviations (filled: sky, open: star) | Spatial sky continuum emission | Spatial sky telluric CO2 absorption deviations (filled: H < 10) | |||||||||||||||||||||||
| 0 | 0 |
|
|
|
|
|
|
| IPAIR | NAME | SHIFT | NEWSHIFT | S/N | NAME | SHIFT | NEWSHIFT | S/N |
| 0 | 18880028 | 0.511425 | 0.00000 | 18.9406 | 18880030 | 0.00183033 | 0.509595 | 18.8951 |
| 1 | 18880027 | 0.510296 | 0.00112903 | 18.8944 | 18880029 | 0.00163719 | 0.509788 | 18.8921 |
| 2 | 18880032 | 0.510616 | 0.000809014 | 18.8773 | 18880033 | 0.00281868 | 0.508606 | 18.8825 |
| 3 | 18880031 | 0.509298 | 0.00212699 | 18.8043 | 18880026 | 0.00000 | 0.511425 | 18.8271 |