| Red | Green | Blue | |
| z | 17.64 | ||
| znorm | Inf | ||
| sky | -NaN | -Inf | -Inf |
| S/N | 28.7 | 45.5 | 52.7 |
| S/N(c) | 14.2 | 49.7 | 54.4 |
| SN(E/C) |
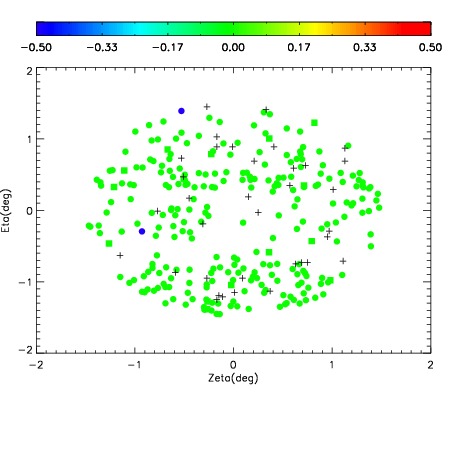
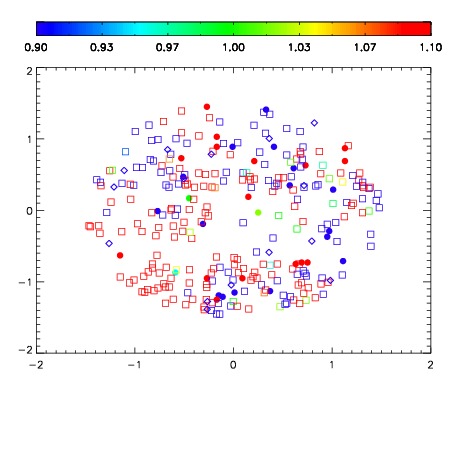
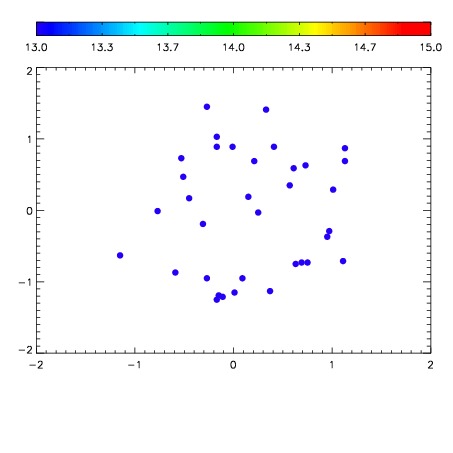

| Frame | Nreads | Zeropoints | Mag plots | Spatial mag deviation | Spatial sky 16325A emission deviations (filled: sky, open: star) | Spatial sky continuum emission | Spatial sky telluric CO2 absorption deviations (filled: H < 10) | |||||||||||||||||||||||
| 0 | 0 |
|
|
|
|
|
|
| IPAIR | NAME | SHIFT | NEWSHIFT | S/N | NAME | SHIFT | NEWSHIFT | S/N |
| 0 | 18860067 | 0.00000 | 0.00000 | 18.7039 | 18860068 | -0.516667 | 0.516667 | 18.5946 |
| 1 | 18860071 | -0.00402154 | 0.00402154 | 18.7058 | 18860073 | -0.514134 | 0.514134 | 18.6820 |
| 2 | 18860074 | -0.00251988 | 0.00251988 | 18.5708 | 18860072 | -0.513721 | 0.513721 | 18.5519 |
| 3 | 18860070 | -0.00439493 | 0.00439493 | 18.4863 | 18860069 | -0.516272 | 0.516272 | 18.3687 |