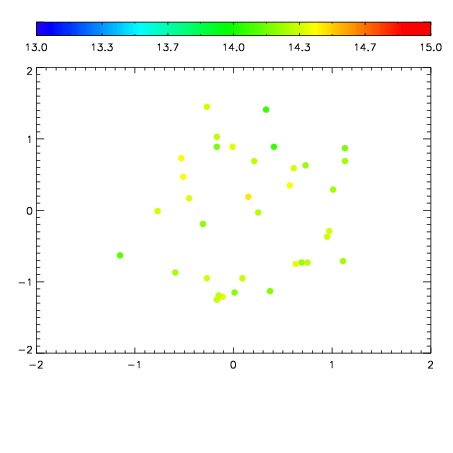
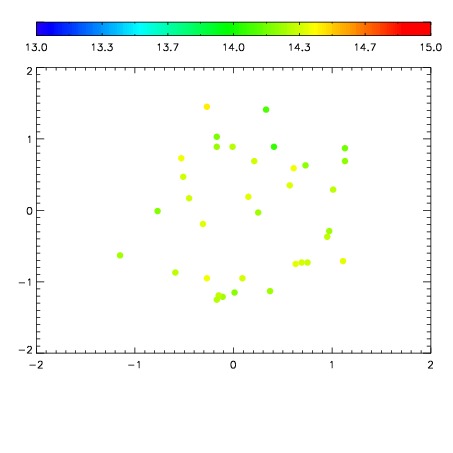
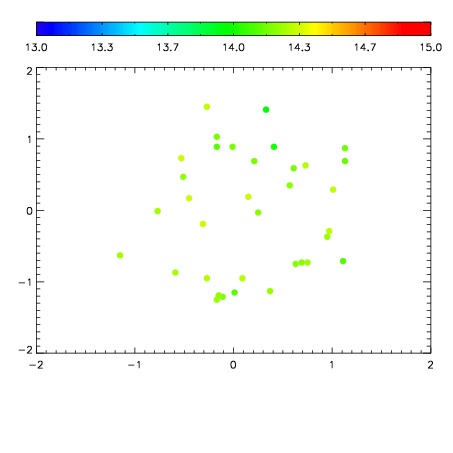
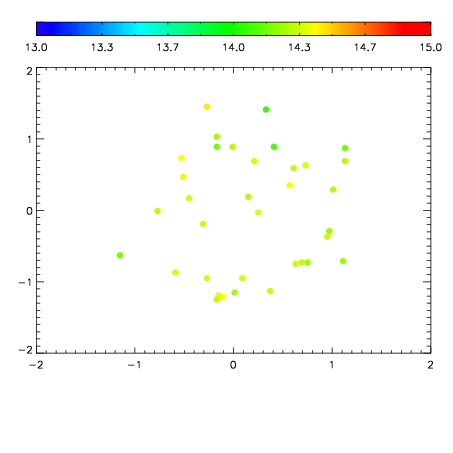
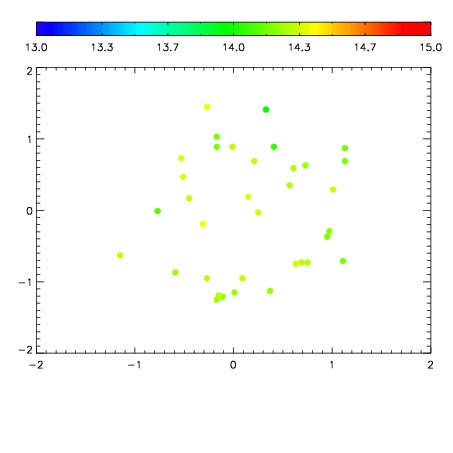
| Frame | Nreads | Zeropoints | Mag plots
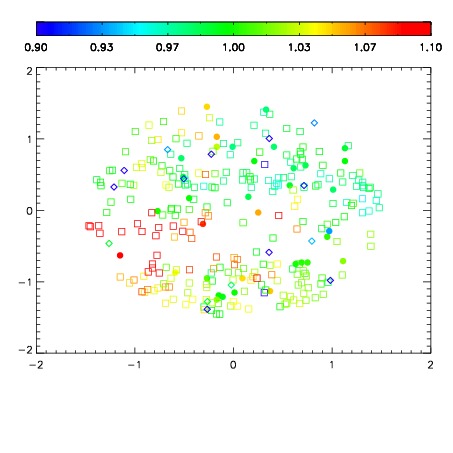
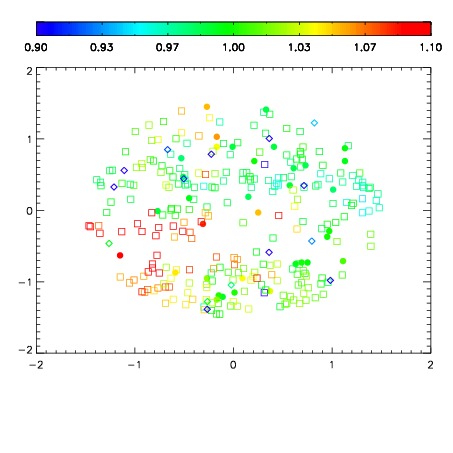
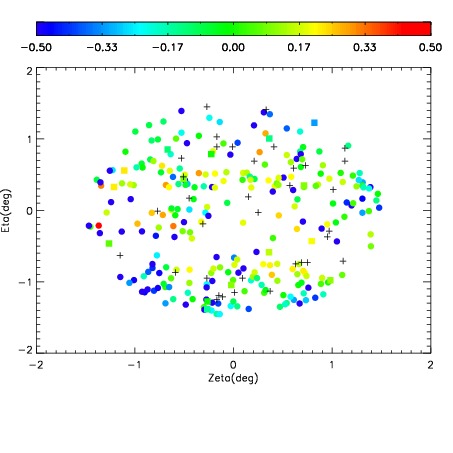
| Spatial mag deviation
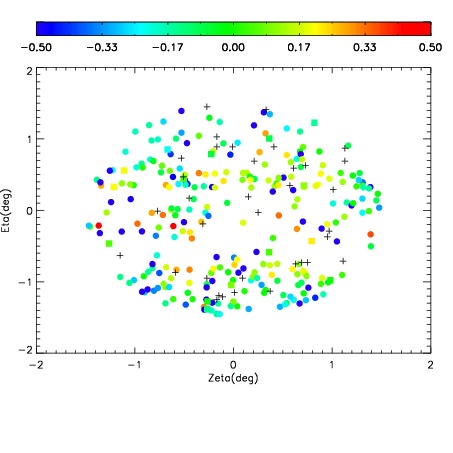
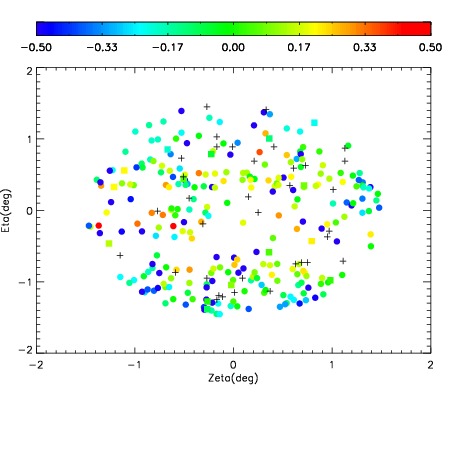
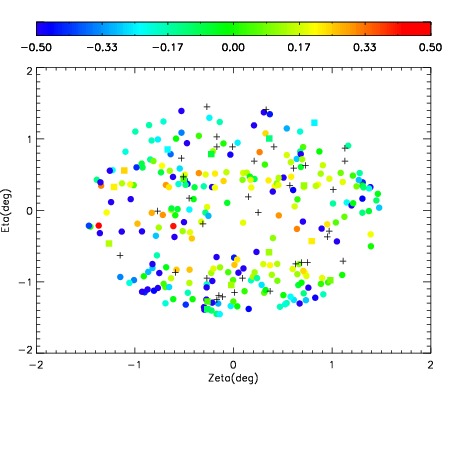
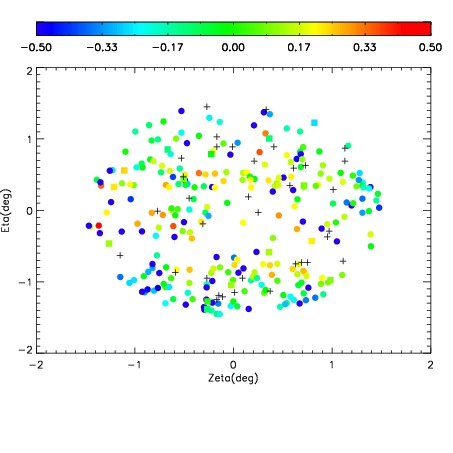
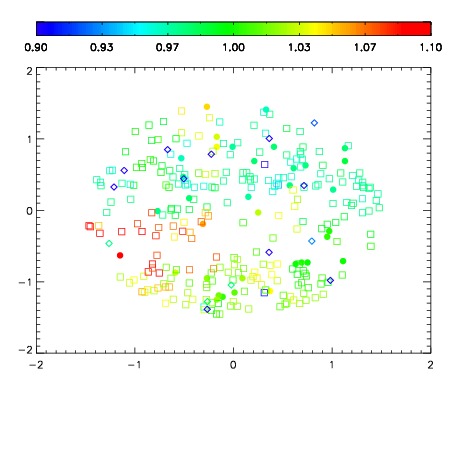
| Spatial sky 16325A emission deviations (filled: sky, open: star)
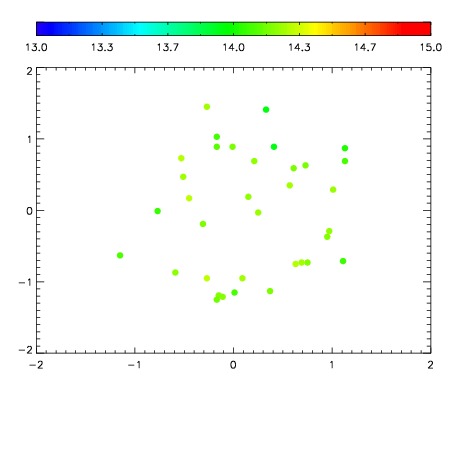
| Spatial sky continuum emission
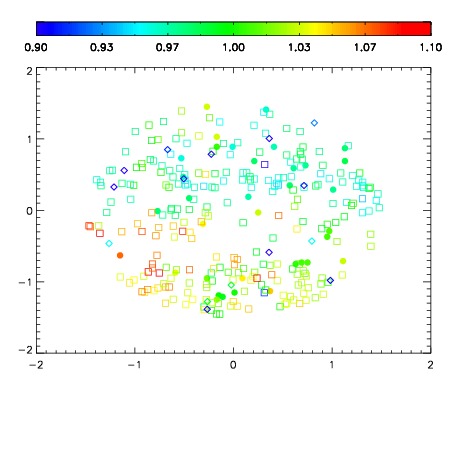
| Spatial sky telluric CO2 absorption deviations (filled: H < 10)
|
| 19090042
| 47
| | Red | Green | Blue
| | z | | 18.67
| | znorm | | 14.48
| | sky | 14.4 | 14.0 | 14.0
| | S/N | 15.2 | 23.0 | 26.4
| | S/N(c) | 8.3 | 23.7 | 8.4
| | SN(E/C) 0.37
|
| 
| 
| 
| 
| 
|
| 19090043
| 47
| | Red | Green | Blue
| | z | | 18.78
| | znorm | | 14.60
| | sky | 14.3 | 14.1 | 14.1
| | S/N | 16.5 | 24.8 | 28.5
| | S/N(c) | 9.2 | 26.2 | 9.2
| | SN(E/C) 0.39
|
| 
| 
| 
| 
| 
|
| 19090044
| 47
| | Red | Green | Blue
| | z | | 18.84
| | znorm | | 14.66
| | sky | 14.5 | 14.3 | 14.0
| | S/N | 16.6 | 25.2 | 28.9
| | S/N(c) | 9.4 | 26.5 | 9.3
| | SN(E/C) 0.34
|
| 
| 
| 
| 
| 
|
| 19090045
| 47
| | Red | Green | Blue
| | z | | 18.90
| | znorm | | 14.72
| | sky | 14.4 | 14.3 | 14.2
| | S/N | 17.5 | 26.3 | 30.1
| | S/N(c) | 9.6 | 27.2 | 9.7
| | SN(E/C) 0.35
|
| 
| 
| 
| 
| 
|
| 19090046
| 47
| | Red | Green | Blue
| | z | | 18.92
| | znorm | | 14.74
| | sky | 14.3 | 14.2 | 14.1
| | S/N | 17.2 | 26.0 | 29.8
| | S/N(c) | 9.7 | 27.4 | 9.7
| | SN(E/C) 0.37
|
| 
| 
| 
| 
| 
|
| 19090047
| 47
| | Red | Green | Blue
| | z | | 18.89
| | znorm | | 14.71
| | sky | 14.4 | 14.3 | 14.1
| | S/N | 17.3 | 26.0 | 29.8
| | S/N(c) | 9.5 | 26.9 | 9.5
| | SN(E/C) 0.36
|
| 
| 
| 
| 
| 
|
| 19090048
| 47
| | Red | Green | Blue
| | z | | 18.89
| | znorm | | 14.71
| | sky | 14.3 | 14.3 | 14.1
| | S/N | 17.0 | 25.7 | 29.4
| | S/N(c) | 9.5 | 26.9 | 9.5
| | SN(E/C) 0.36
|
| 
| 
| 
| 
| 
|
| 19090049
| 47
| | Red | Green | Blue
| | z | | 18.93
| | znorm | | 14.75
| | sky | 14.3 | 14.2 | 14.1
| | S/N | 17.4 | 26.4 | 30.2
| | S/N(c) | 9.4 | 26.6 | 9.5
| | SN(E/C) 0.35
|
| 
| 
| 
| 
| 
|