| Red | Green | Blue | |
| z | 17.64 | ||
| znorm | Inf | ||
| sky | -Inf | -Inf | -Inf |
| S/N | 31.3 | 49.0 | 56.3 |
| S/N(c) | 18.6 | 52.9 | 18.8 |
| SN(E/C) |
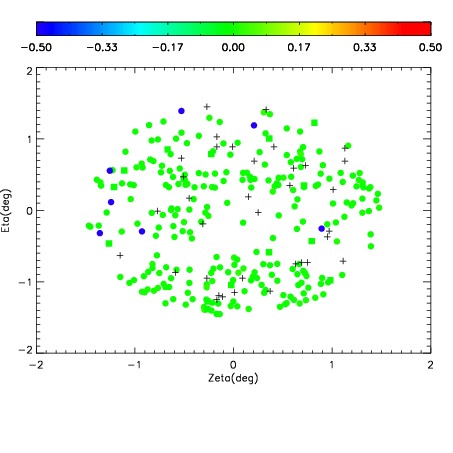
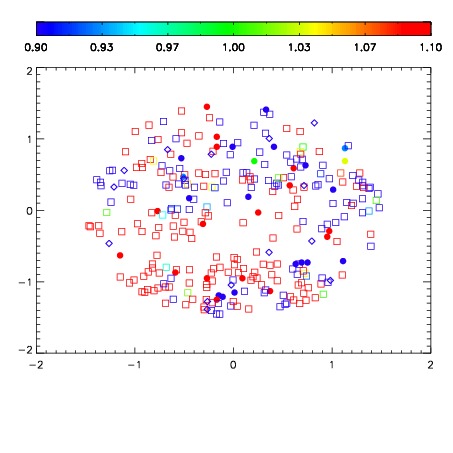
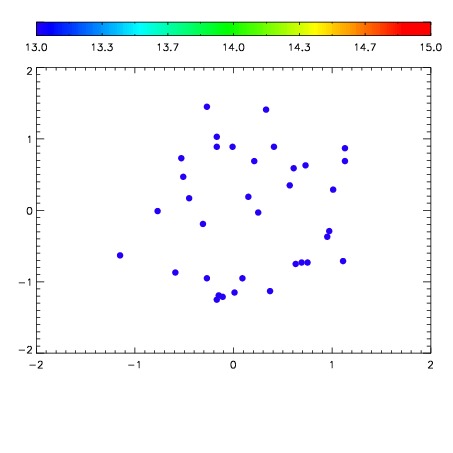

| Frame | Nreads | Zeropoints | Mag plots | Spatial mag deviation | Spatial sky 16325A emission deviations (filled: sky, open: star) | Spatial sky continuum emission | Spatial sky telluric CO2 absorption deviations (filled: H < 10) | |||||||||||||||||||||||
| 0 | 0 |
|
|
|
|
|
|
| IPAIR | NAME | SHIFT | NEWSHIFT | S/N | NAME | SHIFT | NEWSHIFT | S/N |
| 0 | 19090048 | 0.509497 | 0.00000 | 18.8442 | 19090045 | -0.000121556 | 0.509619 | 18.8746 |
| 1 | 19090047 | 0.509423 | 7.39694e-05 | 18.8642 | 19090049 | -0.00122723 | 0.510724 | 18.9053 |
| 2 | 19090044 | 0.507644 | 0.00185299 | 18.8134 | 19090046 | -0.000688501 | 0.510185 | 18.8663 |
| 3 | 19090043 | 0.507336 | 0.00216097 | 18.7654 | 19090042 | 0.00000 | 0.509497 | 18.6321 |