| Red | Green | Blue | |
| z | 17.64 | ||
| znorm | Inf | ||
| sky | -Inf | -NaN | -Inf |
| S/N | 32.8 | 56.2 | 60.3 |
| S/N(c) | 0.0 | 0.0 | 0.0 |
| SN(E/C) |


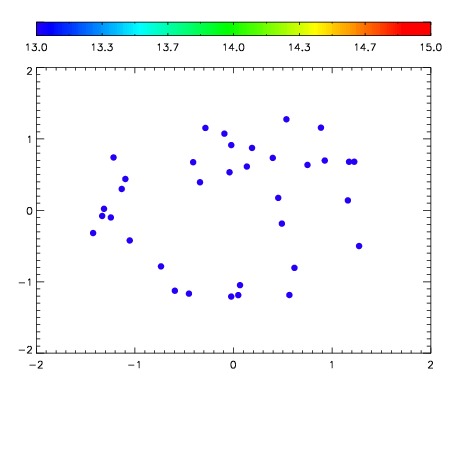

| Frame | Nreads | Zeropoints | Mag plots | Spatial mag deviation | Spatial sky 16325A emission deviations (filled: sky, open: star) | Spatial sky continuum emission | Spatial sky telluric CO2 absorption deviations (filled: H < 10) | |||||||||||||||||||||||
| 0 | 0 |
|
|
|
|
|
|
| IPAIR | NAME | SHIFT | NEWSHIFT | S/N | NAME | SHIFT | NEWSHIFT | S/N |
| 0 | 19440028 | 0.491086 | 0.00000 | 18.0930 | 19440027 | 0.00874078 | 0.482345 | 18.0425 |
| 1 | 19440012 | 0.485461 | 0.00562501 | 18.8882 | 19440011 | 0.00000 | 0.491086 | 18.8813 |
| 2 | 19440017 | 0.486332 | 0.00475401 | 18.7601 | 19440018 | 0.00453146 | 0.486555 | 18.7861 |
| 3 | 19440024 | 0.488938 | 0.00214800 | 18.6399 | 19440023 | 0.00812519 | 0.482961 | 18.6261 |
| 4 | 19440025 | 0.489185 | 0.00190100 | 18.6195 | 19440026 | 0.00815492 | 0.482931 | 18.5505 |
| 5 | 19440029 | 0.491073 | 1.29938e-05 | 18.4814 | 19440030 | 0.0114358 | 0.479650 | 18.5047 |
| 6 | 19440020 | 0.487835 | 0.00325102 | 18.3379 | 19440019 | 0.00511545 | 0.485971 | 18.3553 |
| 7 | 19440013 | 0.485983 | 0.00510299 | 18.1639 | 19440014 | 0.000925770 | 0.490160 | 18.0456 |
| 8 | 19440021 | 0.488468 | 0.00261801 | 17.9012 | 19440022 | 0.00893873 | 0.482147 | 17.9449 |
| 9 | 19440016 | 0.486834 | 0.00425202 | 17.8351 | 19440015 | 0.00128925 | 0.489797 | 17.7563 |