| Red | Green | Blue | |
| z | 17.64 | ||
| znorm | Inf | ||
| sky | -Inf | -Inf | -NaN |
| S/N | 16.8 | 32.6 | 33.9 |
| S/N(c) | 0.0 | 0.0 | 0.0 |
| SN(E/C) |
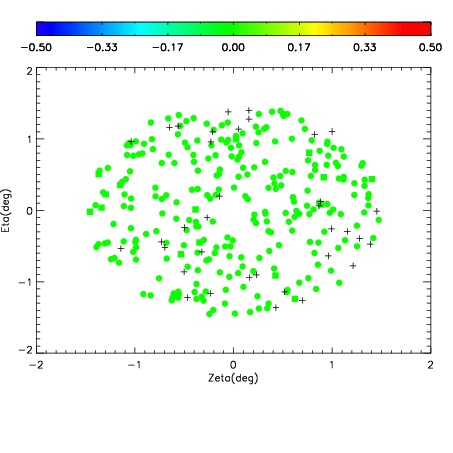
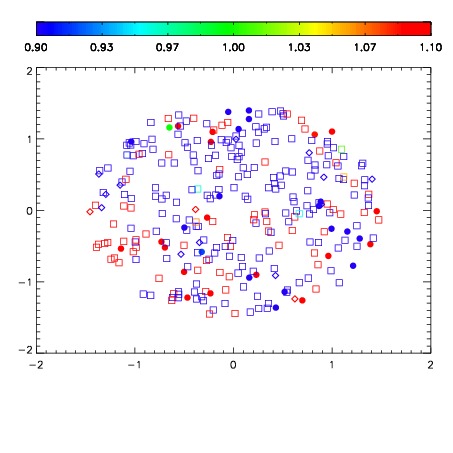
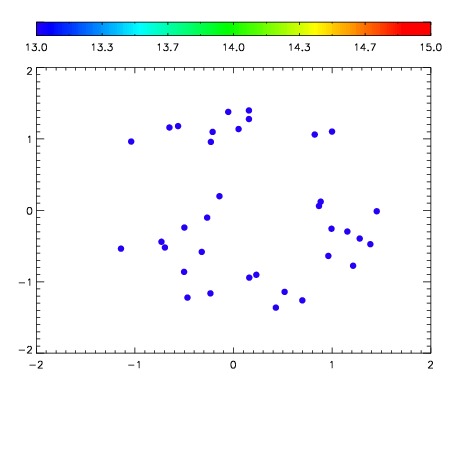

| Frame | Nreads | Zeropoints | Mag plots | Spatial mag deviation | Spatial sky 16325A emission deviations (filled: sky, open: star) | Spatial sky continuum emission | Spatial sky telluric CO2 absorption deviations (filled: H < 10) | |||||||||||||||||||||||
| 0 | 0 |
|
|
|
|
|
|
| IPAIR | NAME | SHIFT | NEWSHIFT | S/N | NAME | SHIFT | NEWSHIFT | S/N |
| 0 | 19460017 | 0.491356 | 0.00000 | 18.6648 | 19460014 | 0.00193611 | 0.489420 | 18.6614 |
| 1 | 19460016 | 0.491348 | 7.98702e-06 | 18.6810 | 19460015 | 0.00122727 | 0.490129 | 18.6929 |
| 2 | 19460012 | 0.490290 | 0.00106600 | 18.6553 | 19460018 | -0.000602455 | 0.491958 | 18.5977 |
| 3 | 19460013 | 0.490991 | 0.000364989 | 18.5738 | 19460011 | 0.00000 | 0.491356 | 18.5702 |
| 4 | 19460020 | 0.489552 | 0.00180399 | 18.2363 | 19460019 | 3.98391e-06 | 0.491352 | 18.4490 |
| 5 | 19460021 | 0.490524 | 0.000831991 | 18.0739 | 19460022 | 0.00138100 | 0.489975 | 17.8364 |