| Red | Green | Blue | |
| z | 17.64 | ||
| znorm | Inf | ||
| sky | -NaN | -Inf | -Inf |
| S/N | 11.0 | 21.6 | 23.4 |
| S/N(c) | 0.0 | 0.0 | 0.0 |
| SN(E/C) |
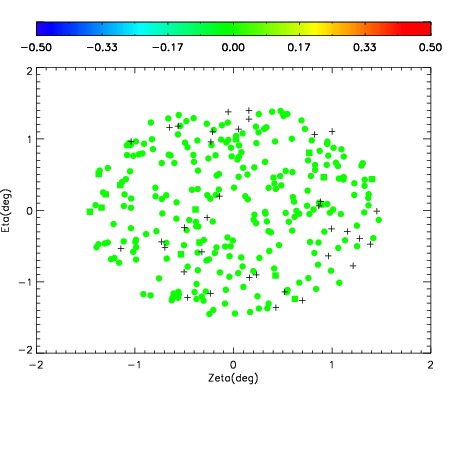
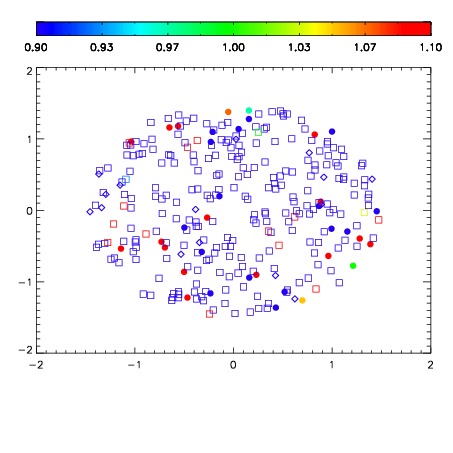
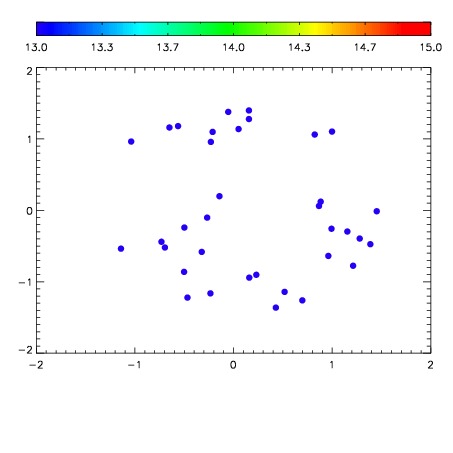

| Frame | Nreads | Zeropoints | Mag plots | Spatial mag deviation | Spatial sky 16325A emission deviations (filled: sky, open: star) | Spatial sky continuum emission | Spatial sky telluric CO2 absorption deviations (filled: H < 10) | |||||||||||||||||||||||
| 0 | 0 |
|
|
|
|
|
|
| IPAIR | NAME | SHIFT | NEWSHIFT | S/N | NAME | SHIFT | NEWSHIFT | S/N |
| 0 | 19710013 | 0.493369 | 0.00000 | 18.1911 | 19710014 | 0.00162428 | 0.491745 | 18.1603 |
| 1 | 19710012 | 0.491801 | 0.00156802 | 18.9477 | 19710011 | 0.00000 | 0.493369 | 18.9769 |
| 2 | 19710017 | 0.490340 | 0.00302902 | 18.6282 | 19710018 | -0.000809193 | 0.494178 | 18.6406 |
| 3 | 19710016 | 0.491687 | 0.00168201 | 18.3364 | 19710015 | 0.00208000 | 0.491289 | 18.2887 |