| Red | Green | Blue | |
| z | 17.64 | ||
| znorm | Inf | ||
| sky | -Inf | -NaN | -NaN |
| S/N | 13.0 | 26.1 | 27.8 |
| S/N(c) | 0.0 | 0.0 | 0.0 |
| SN(E/C) |
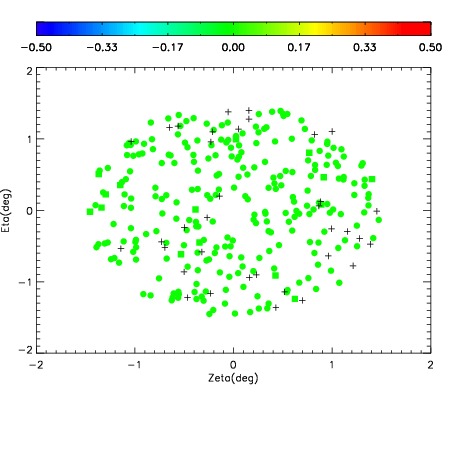
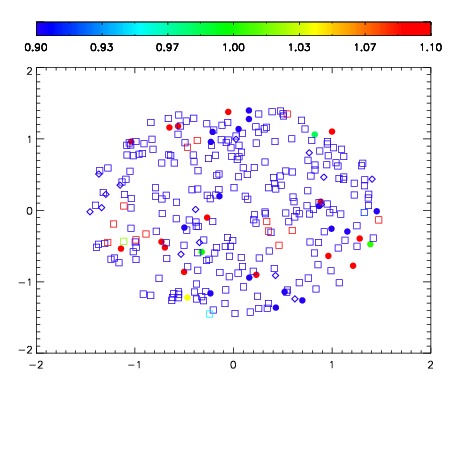
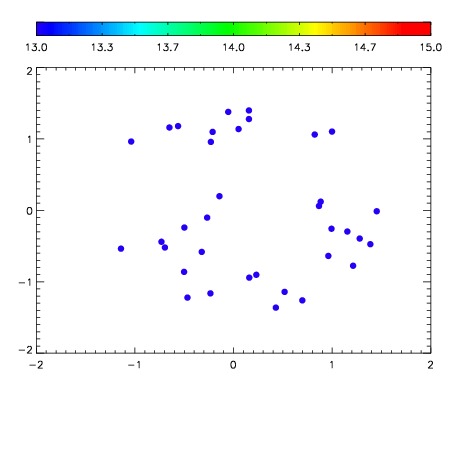

| Frame | Nreads | Zeropoints | Mag plots | Spatial mag deviation | Spatial sky 16325A emission deviations (filled: sky, open: star) | Spatial sky continuum emission | Spatial sky telluric CO2 absorption deviations (filled: H < 10) | |||||||||||||||||||||||
| 0 | 0 |
|
|
|
|
|
|
| IPAIR | NAME | SHIFT | NEWSHIFT | S/N | NAME | SHIFT | NEWSHIFT | S/N |
| 0 | 19720021 | 0.495105 | 0.00000 | 18.4810 | 19720022 | 0.00768348 | 0.487422 | 18.4840 |
| 1 | 19720012 | 0.492369 | 0.00273600 | 18.6866 | 19720011 | 0.00000 | 0.495105 | 18.7901 |
| 2 | 19720017 | 0.491049 | 0.00405601 | 18.5888 | 19720018 | 0.00280411 | 0.492301 | 18.5684 |
| 3 | 19720016 | 0.491713 | 0.00339201 | 18.3843 | 19720015 | 0.00215724 | 0.492948 | 18.3756 |
| 4 | 19720024 | 0.492540 | 0.00256500 | 18.2574 | 19720023 | 0.00650704 | 0.488598 | 18.2865 |
| 5 | 19720013 | 0.493960 | 0.00114501 | 18.1756 | 19720014 | 0.00188567 | 0.493219 | 18.0497 |
| 6 | 19720020 | 0.493608 | 0.00149700 | 18.0806 | 19720019 | 0.00369280 | 0.491412 | 17.8657 |