| Red | Green | Blue | |
| z | 17.64 | ||
| znorm | Inf | ||
| sky | -Inf | -Inf | -Inf |
| S/N | 23.9 | 45.3 | 47.1 |
| S/N(c) | 0.0 | 0.0 | 0.0 |
| SN(E/C) |
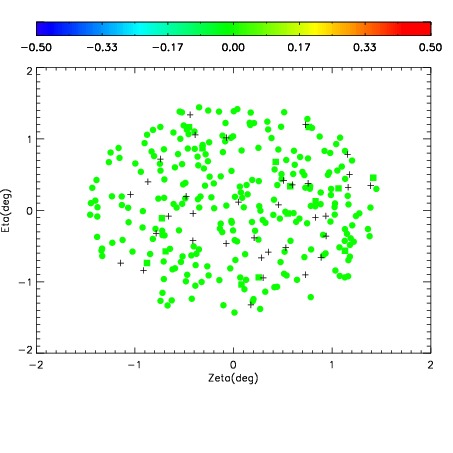
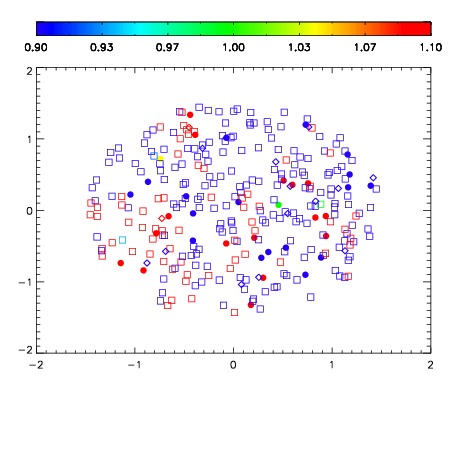
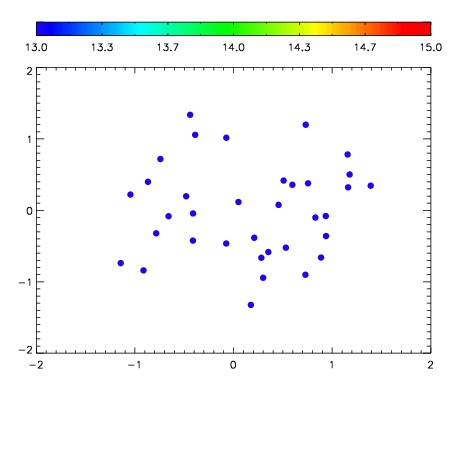

| Frame | Nreads | Zeropoints | Mag plots | Spatial mag deviation | Spatial sky 16325A emission deviations (filled: sky, open: star) | Spatial sky continuum emission | Spatial sky telluric CO2 absorption deviations (filled: H < 10) | |||||||||||||||||||||||
| 0 | 0 |
|
|
|
|
|
|
| IPAIR | NAME | SHIFT | NEWSHIFT | S/N | NAME | SHIFT | NEWSHIFT | S/N |
| 0 | 18970033 | 0.517557 | 0.00000 | 17.0117 | 18970011 | 0.00000 | 0.517557 | 17.6872 |
| 1 | 18970029 | 0.515426 | 0.00213104 | 18.7812 | 18970023 | 0.00499756 | 0.512559 | 18.6913 |
| 2 | 18970024 | 0.511354 | 0.00620300 | 18.7434 | 18970030 | 0.0113533 | 0.506204 | 18.6172 |
| 3 | 18970025 | 0.513448 | 0.00410903 | 18.4131 | 18970026 | 0.00682064 | 0.510736 | 18.3782 |
| 4 | 18970020 | 0.510373 | 0.00718403 | 18.3397 | 18970022 | 0.00473685 | 0.512820 | 18.2821 |
| 5 | 18970017 | 0.509885 | 0.00767201 | 18.3287 | 18970031 | 0.0124439 | 0.505113 | 18.1534 |
| 6 | 18970021 | 0.510611 | 0.00694603 | 18.3129 | 18970027 | 0.00805286 | 0.509504 | 18.0510 |
| 7 | 18970032 | 0.517503 | 5.40018e-05 | 18.2170 | 18970018 | 0.00363724 | 0.513920 | 17.9416 |
| 8 | 18970028 | 0.514476 | 0.00308102 | 18.0556 | 18970019 | 0.00387291 | 0.513684 | 17.7919 |
| 9 | 18970016 | 0.510048 | 0.00750905 | 16.9869 | 18970015 | 0.00425684 | 0.513300 | 16.8419 |
| 10 | 18970012 | 0.507342 | 0.0102150 | 15.7264 | 18970034 | 0.0101555 | 0.507402 | 16.7540 |