| Red | Green | Blue | |
| z | 17.64 | ||
| znorm | Inf | ||
| sky | -Inf | -Inf | -Inf |
| S/N | 15.4 | 29.8 | 32.4 |
| S/N(c) | 0.0 | 0.0 | 0.0 |
| SN(E/C) |
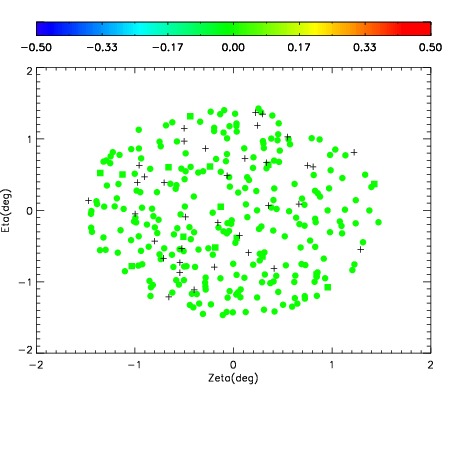
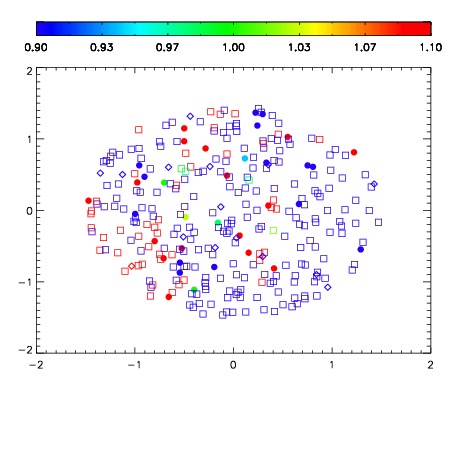
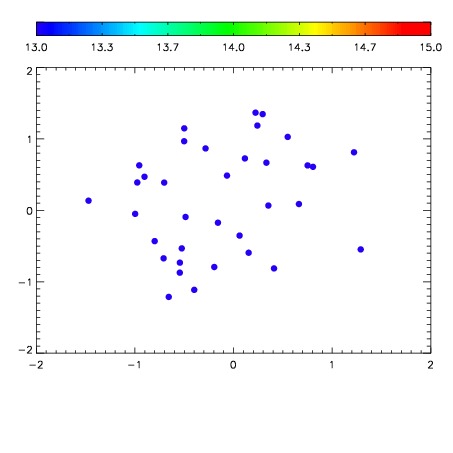

| Frame | Nreads | Zeropoints | Mag plots | Spatial mag deviation | Spatial sky 16325A emission deviations (filled: sky, open: star) | Spatial sky continuum emission | Spatial sky telluric CO2 absorption deviations (filled: H < 10) | |||||||||||||||||||||||
| 0 | 0 |
|
|
|
|
|
|
| IPAIR | NAME | SHIFT | NEWSHIFT | S/N | NAME | SHIFT | NEWSHIFT | S/N |
| 0 | 19220024 | 0.503645 | 0.00000 | 17.7591 | 19220023 | 0.00706785 | 0.496577 | 17.8831 |
| 1 | 19220016 | 0.499654 | 0.00399101 | 18.5023 | 19220011 | 0.00000 | 0.503645 | 18.7042 |
| 2 | 19220025 | 0.503066 | 0.000579000 | 18.3714 | 19220015 | 0.00546143 | 0.498184 | 18.3603 |
| 3 | 19220021 | 0.500299 | 0.00334603 | 18.3019 | 19220022 | 0.00804436 | 0.495601 | 18.2783 |
| 4 | 19220020 | 0.499801 | 0.00384399 | 18.1936 | 19220026 | 0.00840991 | 0.495235 | 18.1743 |
| 5 | 19220017 | 0.500001 | 0.00364399 | 18.1320 | 19220019 | 0.00652124 | 0.497124 | 18.1619 |
| 6 | 19220012 | 0.499637 | 0.00400800 | 17.9038 | 19220014 | 0.00541821 | 0.498227 | 18.1544 |
| 7 | 19220013 | 0.499222 | 0.00442299 | 17.8773 | 19220027 | 0.00879289 | 0.494852 | 18.0332 |
| 8 | 19220028 | 0.500580 | 0.00306499 | 17.7688 | 19220018 | 0.00680123 | 0.496844 | 18.0163 |
| 9 | 19220029 | 0.502328 | 0.00131702 | 16.5430 | 19220030 | 0.00629706 | 0.497348 | 16.8128 |