| Red | Green | Blue | |
| z | 17.64 | ||
| znorm | Inf | ||
| sky | -Inf | -Inf | -NaN |
| S/N | 11.3 | 22.1 | 23.5 |
| S/N(c) | 0.0 | 0.0 | 0.0 |
| SN(E/C) |
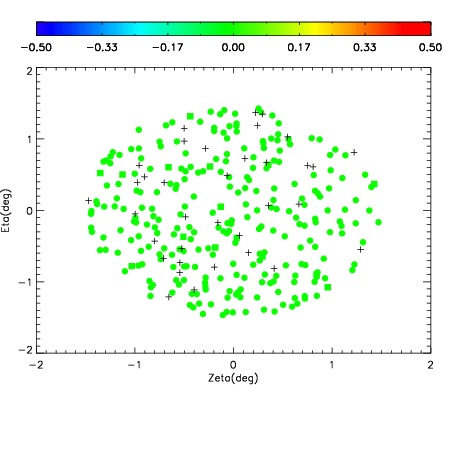

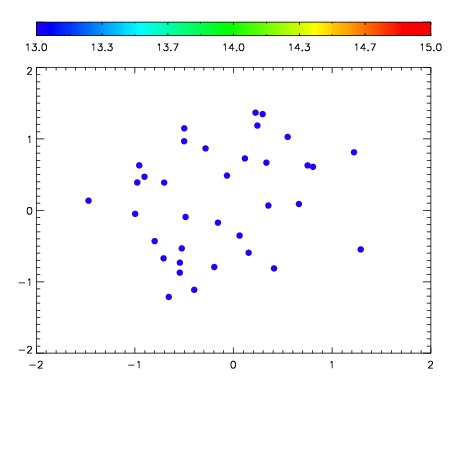

| Frame | Nreads | Zeropoints | Mag plots | Spatial mag deviation | Spatial sky 16325A emission deviations (filled: sky, open: star) | Spatial sky continuum emission | Spatial sky telluric CO2 absorption deviations (filled: H < 10) | |||||||||||||||||||||||
| 0 | 0 |
|
|
|
|
|
|
| IPAIR | NAME | SHIFT | NEWSHIFT | S/N | NAME | SHIFT | NEWSHIFT | S/N |
| 0 | 19230025 | 0.505676 | 0.00000 | 17.9069 | 19230023 | 0.00582365 | 0.499852 | 17.9468 |
| 1 | 19230012 | 0.504261 | 0.00141495 | 18.7996 | 19230011 | 0.00000 | 0.505676 | 18.7454 |
| 2 | 19230020 | 0.504789 | 0.000886977 | 18.2255 | 19230015 | 0.00114317 | 0.504533 | 18.2871 |
| 3 | 19230016 | 0.505662 | 1.39475e-05 | 18.1989 | 19230019 | 0.00432932 | 0.501347 | 18.2235 |
| 4 | 19230017 | 0.505633 | 4.29749e-05 | 17.8899 | 19230018 | 0.00444386 | 0.501232 | 17.9315 |
| 5 | 19230024 | 0.505244 | 0.000431955 | 17.8363 | 19230026 | 0.00575370 | 0.499922 | 17.7668 |
| 6 | 19230013 | 0.505442 | 0.000233948 | 17.7737 | 19230014 | 0.00113837 | 0.504538 | 17.5612 |
| 7 | 19230021 | 0.505576 | 9.99570e-05 | 17.6458 | 19230022 | 0.00592840 | 0.499748 | 17.1811 |