| Red | Green | Blue | |
| z | 17.64 | ||
| znorm | Inf | ||
| sky | -Inf | -Inf | -NaN |
| S/N | 10.7 | 19.0 | 20.5 |
| S/N(c) | 0.0 | 0.0 | 0.0 |
| SN(E/C) |

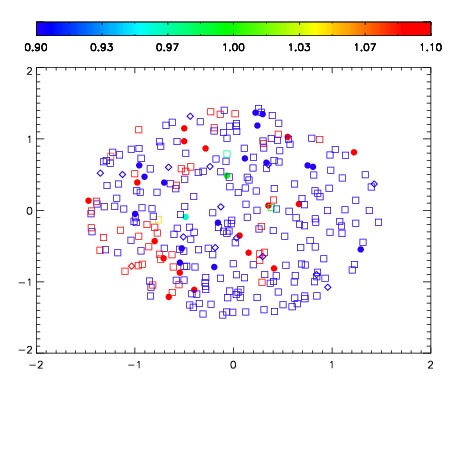


| Frame | Nreads | Zeropoints | Mag plots | Spatial mag deviation | Spatial sky 16325A emission deviations (filled: sky, open: star) | Spatial sky continuum emission | Spatial sky telluric CO2 absorption deviations (filled: H < 10) | |||||||||||||||||||||||
| 0 | 0 |
|
|
|
|
|
|
| IPAIR | NAME | SHIFT | NEWSHIFT | S/N | NAME | SHIFT | NEWSHIFT | S/N |
| 0 | 19260013 | 0.497210 | 0.00000 | 18.5986 | 19260014 | 0.00304834 | 0.494162 | 18.6374 |
| 1 | 19260012 | 0.496489 | 0.000721008 | 19.1662 | 19260011 | 0.00000 | 0.497210 | 19.1547 |
| 2 | 19260016 | 0.495860 | 0.00134999 | 18.1013 | 19260015 | 0.00308776 | 0.494122 | 18.2021 |