| Red | Green | Blue | |
| z | 17.64 | ||
| znorm | Inf | ||
| sky | -Inf | -Inf | -Inf |
| S/N | 25.2 | 44.0 | 50.9 |
| S/N(c) | 0.0 | 0.0 | 0.0 |
| SN(E/C) |
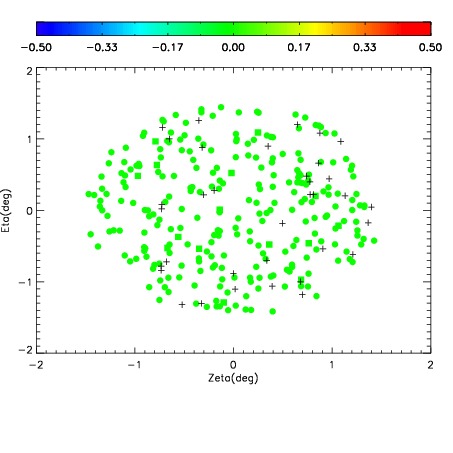
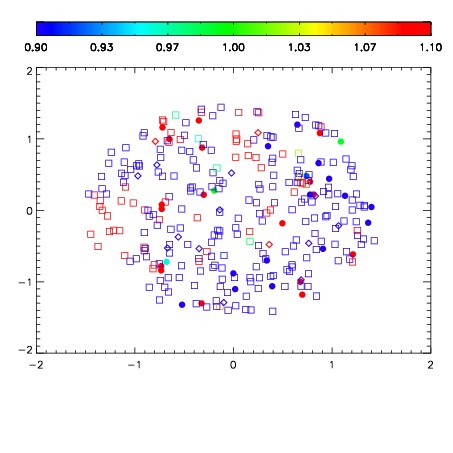


| Frame | Nreads | Zeropoints | Mag plots | Spatial mag deviation | Spatial sky 16325A emission deviations (filled: sky, open: star) | Spatial sky continuum emission | Spatial sky telluric CO2 absorption deviations (filled: H < 10) | |||||||||||||||||||||||
| 0 | 0 |
|
|
|
|
|
|
| IPAIR | NAME | SHIFT | NEWSHIFT | S/N | NAME | SHIFT | NEWSHIFT | S/N |
| 0 | 19140025 | 0.512576 | 0.00000 | 14.8021 | 19140026 | 0.00257686 | 0.509999 | 15.3723 |
| 1 | 19140020 | 0.505213 | 0.00736296 | 18.4850 | 19140019 | 0.00148233 | 0.511094 | 18.4803 |
| 2 | 19140013 | 0.502302 | 0.0102740 | 18.4266 | 19140014 | 0.00121783 | 0.511358 | 18.4616 |
| 3 | 19140017 | 0.503063 | 0.00951296 | 18.3913 | 19140023 | 0.000785566 | 0.511790 | 18.4036 |
| 4 | 19140016 | 0.502922 | 0.00965399 | 18.3122 | 19140018 | 0.00126425 | 0.511312 | 18.3869 |
| 5 | 19140012 | 0.500929 | 0.0116470 | 18.1397 | 19140011 | 0.00000 | 0.512576 | 18.3417 |
| 6 | 19140021 | 0.505500 | 0.00707597 | 17.9571 | 19140015 | 0.00125677 | 0.511319 | 18.3333 |
| 7 | 19140024 | 0.508969 | 0.00360698 | 17.7168 | 19140022 | 0.00140248 | 0.511173 | 17.9398 |
| 8 | 19140028 | 0.508289 | 0.00428700 | 15.5828 | 19140027 | 0.00244329 | 0.510133 | 15.3914 |