| Red | Green | Blue | |
| z | 17.64 | ||
| znorm | Inf | ||
| sky | -Inf | -Inf | -NaN |
| S/N | 16.9 | 29.5 | 33.9 |
| S/N(c) | 0.0 | 0.0 | 0.0 |
| SN(E/C) |
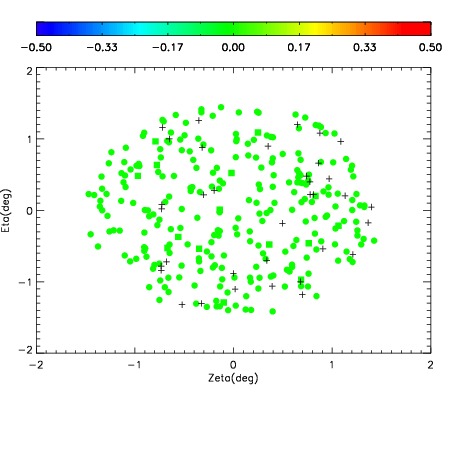
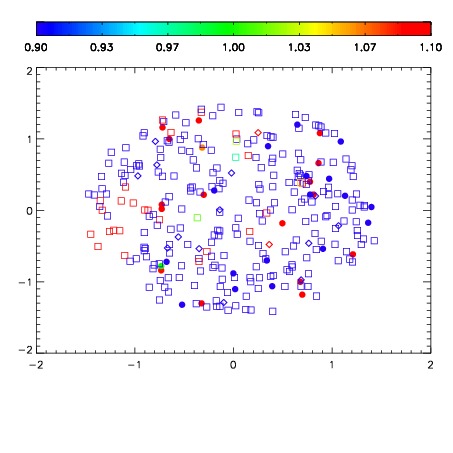


| Frame | Nreads | Zeropoints | Mag plots | Spatial mag deviation | Spatial sky 16325A emission deviations (filled: sky, open: star) | Spatial sky continuum emission | Spatial sky telluric CO2 absorption deviations (filled: H < 10) | |||||||||||||||||||||||
| 0 | 0 |
|
|
|
|
|
|
| IPAIR | NAME | SHIFT | NEWSHIFT | S/N | NAME | SHIFT | NEWSHIFT | S/N |
| 0 | 19190022 | 0.500081 | 0.00000 | 18.0207 | 19190023 | -0.000562704 | 0.500644 | 17.9914 |
| 1 | 19190025 | 0.499733 | 0.000348002 | 18.4372 | 19190024 | -0.00195729 | 0.502038 | 18.4822 |
| 2 | 19190021 | 0.499286 | 0.000795007 | 18.3307 | 19190020 | 0.00000 | 0.500081 | 18.3036 |