| Red | Green | Blue | |
| z | 17.64 | ||
| znorm | Inf | ||
| sky | -Inf | -NaN | -NaN |
| S/N | 21.8 | 36.5 | 41.8 |
| S/N(c) | 0.0 | 0.0 | 0.0 |
| SN(E/C) |
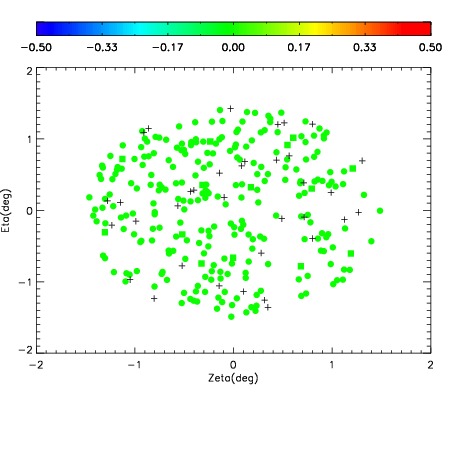
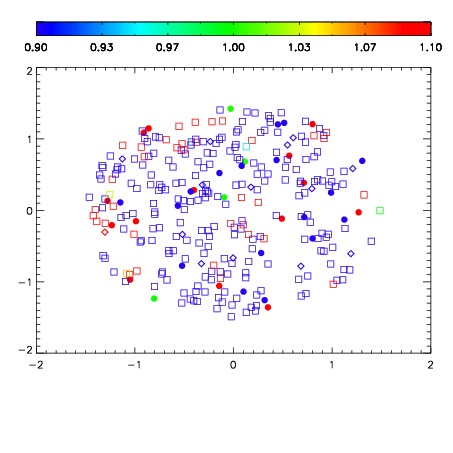


| Frame | Nreads | Zeropoints | Mag plots | Spatial mag deviation | Spatial sky 16325A emission deviations (filled: sky, open: star) | Spatial sky continuum emission | Spatial sky telluric CO2 absorption deviations (filled: H < 10) | |||||||||||||||||||||||
| 0 | 0 |
|
|
|
|
|
|
| IPAIR | NAME | SHIFT | NEWSHIFT | S/N | NAME | SHIFT | NEWSHIFT | S/N |
| 0 | 19190014 | 0.505090 | 0.00000 | 17.9528 | 19190013 | 0.00308183 | 0.502008 | 17.8579 |
| 1 | 19190010 | 0.501918 | 0.00317198 | 18.8843 | 19190009 | 0.00000 | 0.505090 | 18.8082 |
| 2 | 19190015 | 0.504559 | 0.000531018 | 18.6928 | 19190016 | 0.00456145 | 0.500529 | 18.5888 |
| 3 | 19190011 | 0.503110 | 0.00198001 | 17.8574 | 19190012 | 0.00279777 | 0.502292 | 17.7481 |