| Red | Green | Blue | |
| z | 17.64 | ||
| znorm | Inf | ||
| sky | -NaN | -Inf | -Inf |
| S/N | 31.5 | 51.7 | 59.0 |
| S/N(c) | 0.0 | 0.0 | 0.0 |
| SN(E/C) |
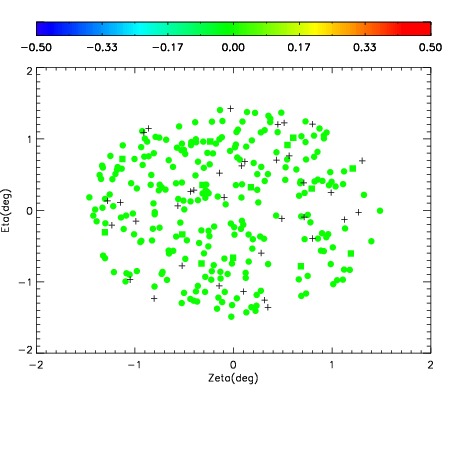
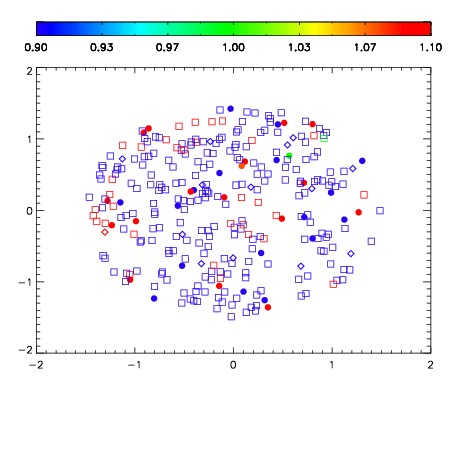
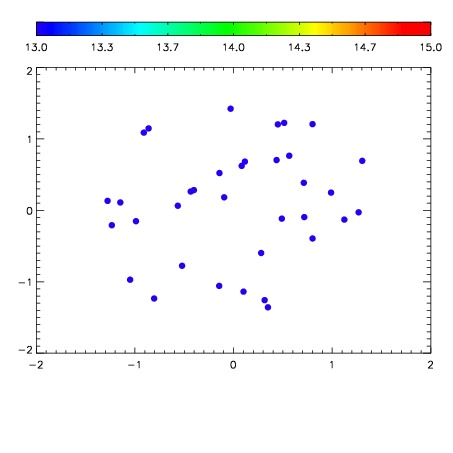

| Frame | Nreads | Zeropoints | Mag plots | Spatial mag deviation | Spatial sky 16325A emission deviations (filled: sky, open: star) | Spatial sky continuum emission | Spatial sky telluric CO2 absorption deviations (filled: H < 10) | |||||||||||||||||||||||
| 0 | 0 |
|
|
|
|
|
|
| IPAIR | NAME | SHIFT | NEWSHIFT | S/N | NAME | SHIFT | NEWSHIFT | S/N |
| 0 | 19200016 | 0.499102 | 0.00000 | 17.9581 | 19200015 | -0.00419741 | 0.503299 | 17.9077 |
| 1 | 19200012 | 0.495757 | 0.00334498 | 19.1301 | 19200011 | 0.00000 | 0.499102 | 19.1166 |
| 2 | 19200017 | 0.497925 | 0.00117698 | 18.8881 | 19200018 | -0.00538853 | 0.504491 | 18.8528 |
| 3 | 19200024 | 0.495357 | 0.00374499 | 18.8189 | 19200023 | -0.00436697 | 0.503469 | 18.8006 |
| 4 | 19200020 | 0.496236 | 0.00286600 | 18.1583 | 19200022 | -0.00342455 | 0.502527 | 18.1892 |
| 5 | 19200021 | 0.497291 | 0.00181100 | 18.1306 | 19200019 | -0.00488594 | 0.503988 | 18.0661 |
| 6 | 19200013 | 0.497306 | 0.00179601 | 17.9074 | 19200014 | -0.00478779 | 0.503890 | 17.8710 |