| Red | Green | Blue | |
| z | 17.64 | ||
| znorm | Inf | ||
| sky | -Inf | -Inf | -Inf |
| S/N | 16.4 | 30.4 | 32.4 |
| S/N(c) | 0.0 | 0.0 | 0.0 |
| SN(E/C) |
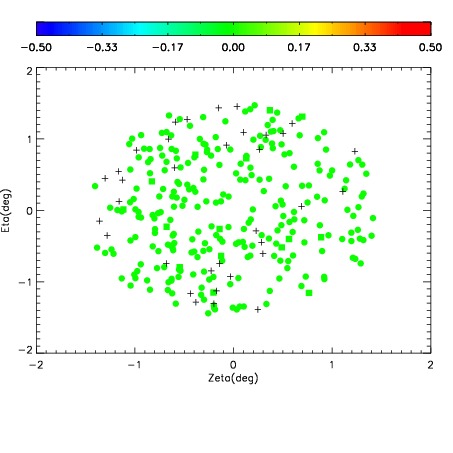


| Frame | Nreads | Zeropoints | Mag plots | Spatial mag deviation | Spatial sky 16325A emission deviations (filled: sky, open: star) | Spatial sky continuum emission | Spatial sky telluric CO2 absorption deviations (filled: H < 10) | |||||||||||||||||||||||
| 0 | 0 |
|
|
|
|
|
|
| IPAIR | NAME | SHIFT | NEWSHIFT | S/N | NAME | SHIFT | NEWSHIFT | S/N |
| 0 | 19280023 | 0.494042 | 0.00000 | 18.6927 | 19280022 | 0.00882857 | 0.485213 | 18.6957 |
| 1 | 19280016 | 0.489902 | 0.00414002 | 18.4313 | 19280017 | 0.00582408 | 0.488218 | 18.6176 |
| 2 | 19280011 | 0.487311 | 0.00673100 | 18.4067 | 19280010 | 0.00000 | 0.494042 | 18.3356 |
| 3 | 19280020 | 0.493990 | 5.20051e-05 | 17.7836 | 19280021 | 0.00920644 | 0.484836 | 17.8887 |
| 4 | 19280019 | 0.493006 | 0.00103602 | 17.7144 | 19280018 | 0.00632206 | 0.487720 | 17.6653 |
| 5 | 19280015 | 0.489649 | 0.00439301 | 17.6764 | 19280014 | 0.00256073 | 0.491481 | 17.5833 |
| 6 | 19280012 | 0.487944 | 0.00609800 | 17.4500 | 19280013 | 0.00283171 | 0.491210 | 17.3952 |