| Frame | Nreads | Zeropoints | Mag plots
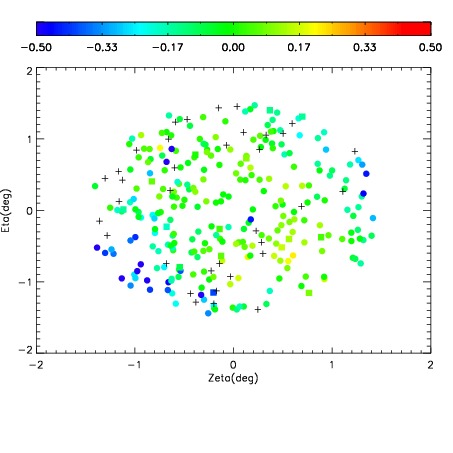
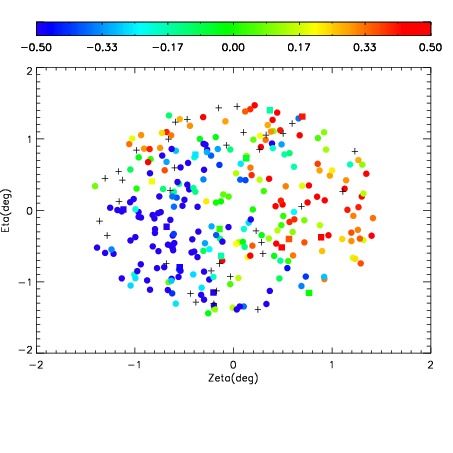
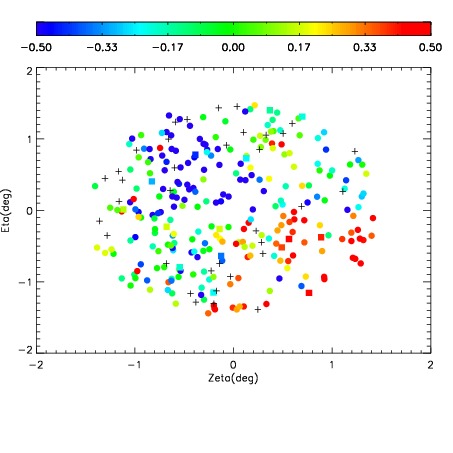
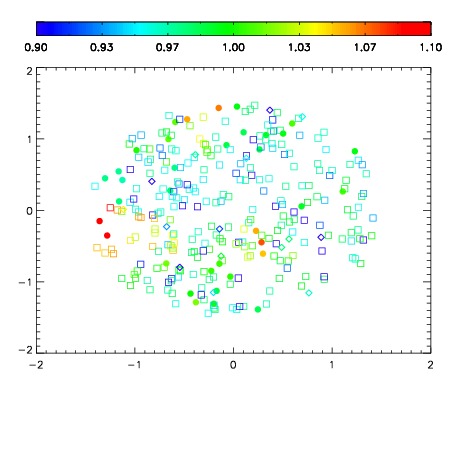
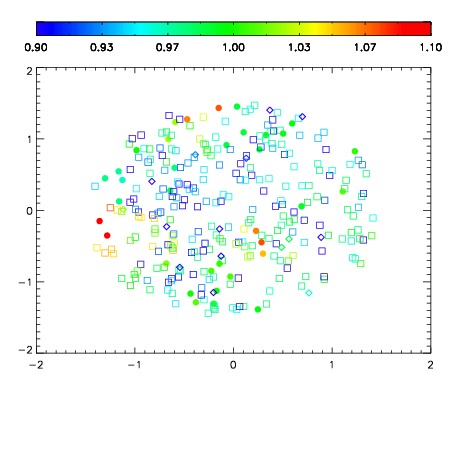
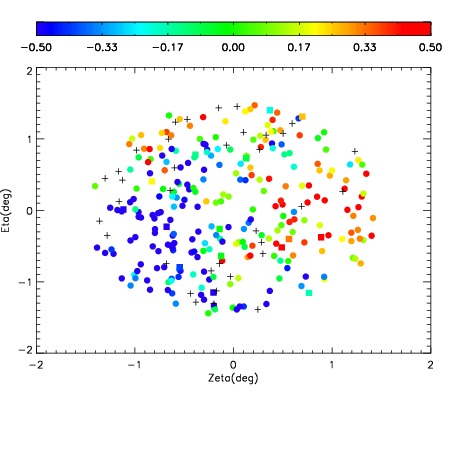
| Spatial mag deviation
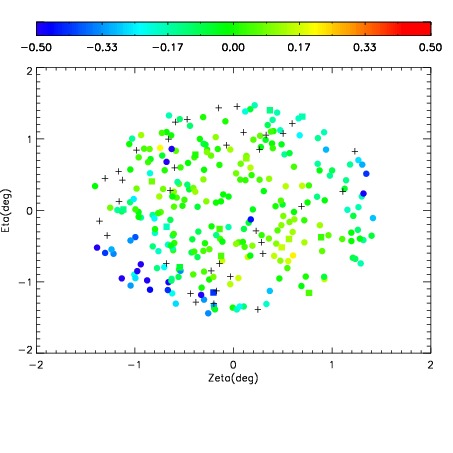
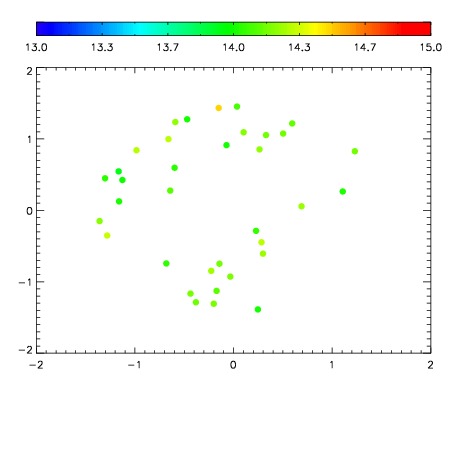
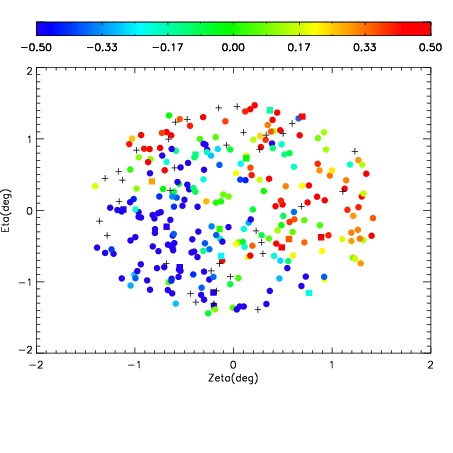
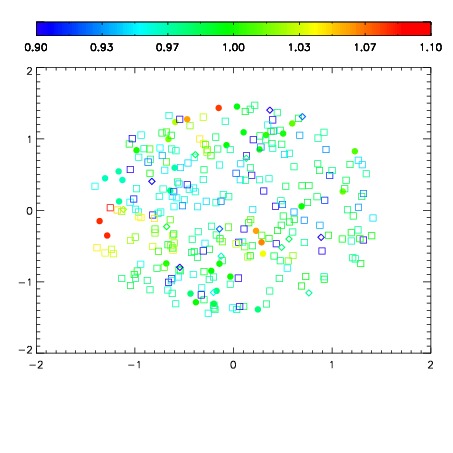
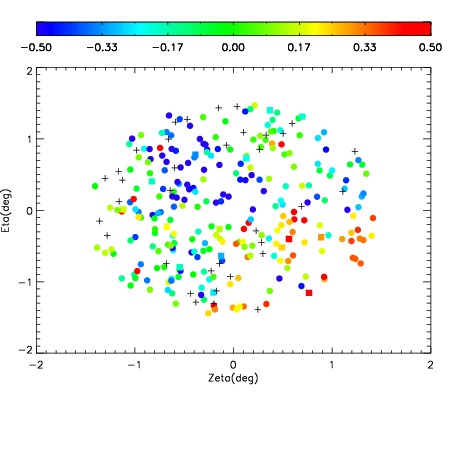
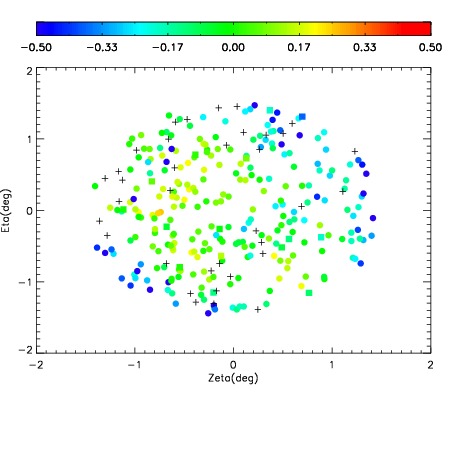
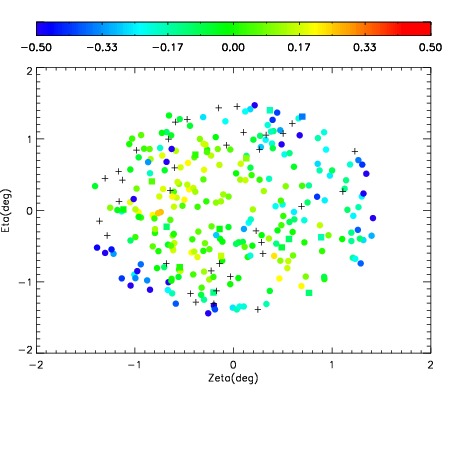
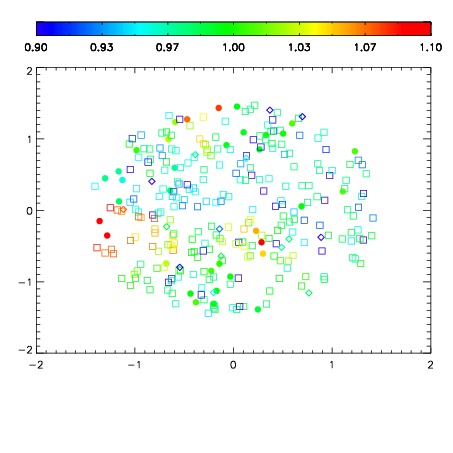
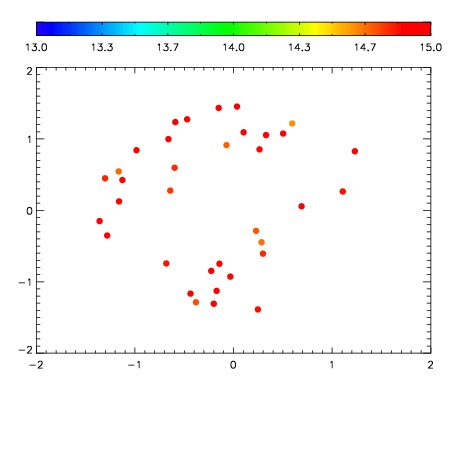
| Spatial sky 16325A emission deviations (filled: sky, open: star)
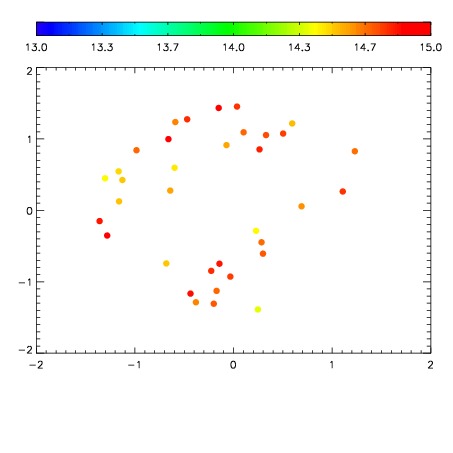
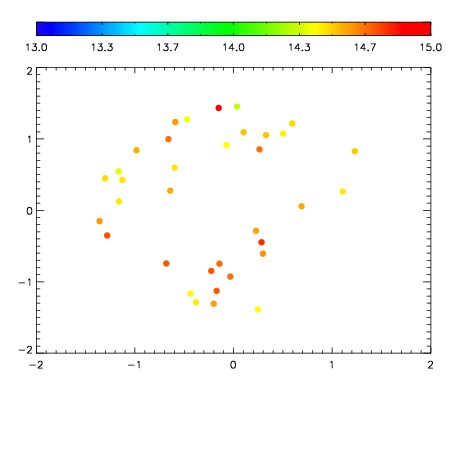
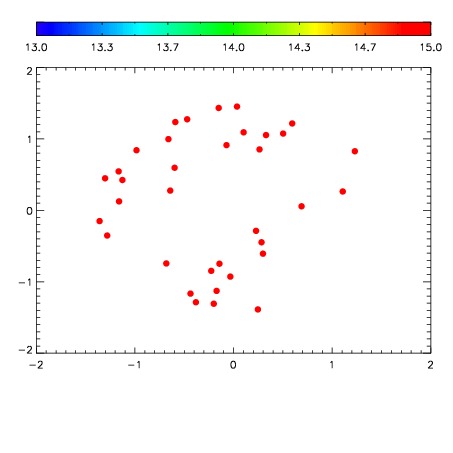
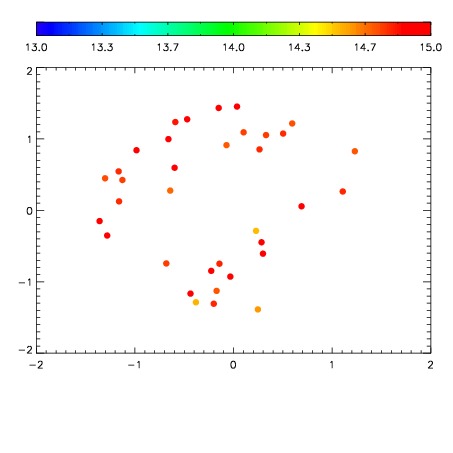
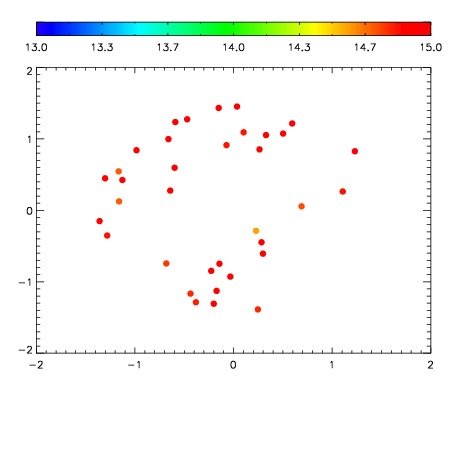
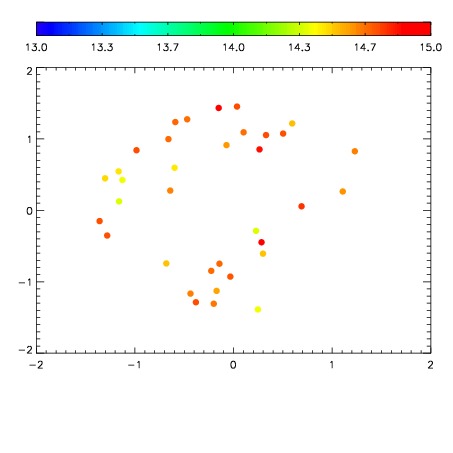
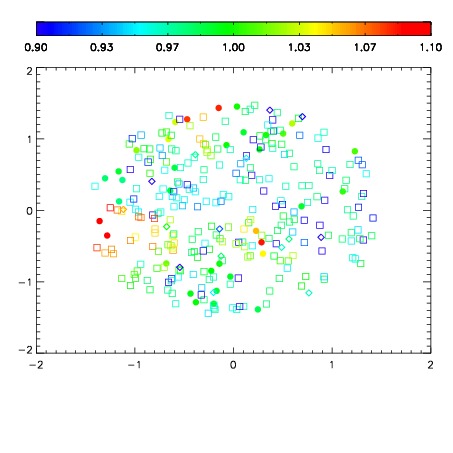
| Spatial sky continuum emission
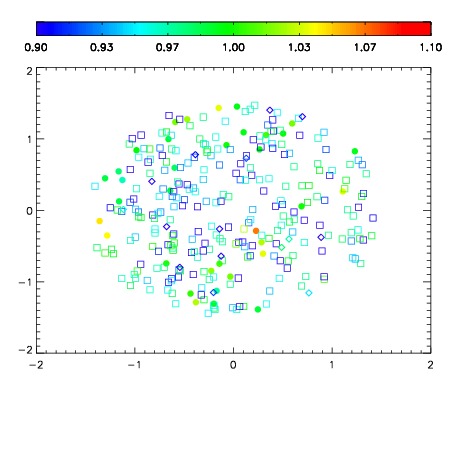
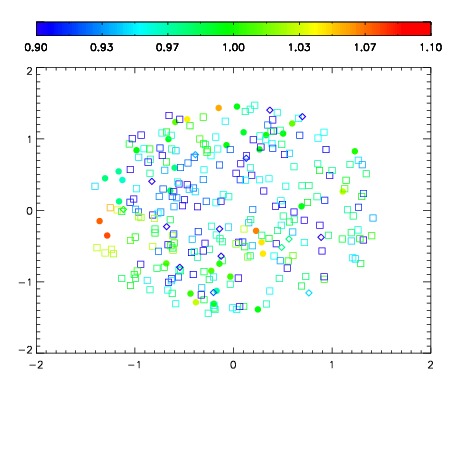
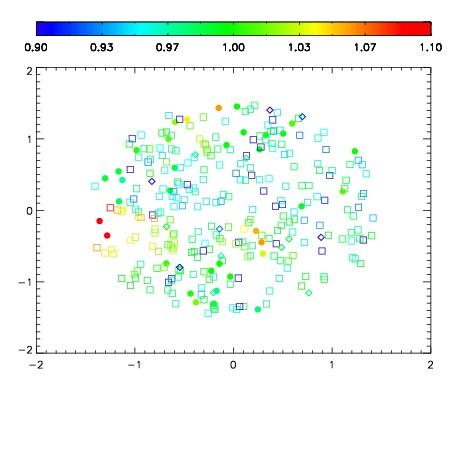
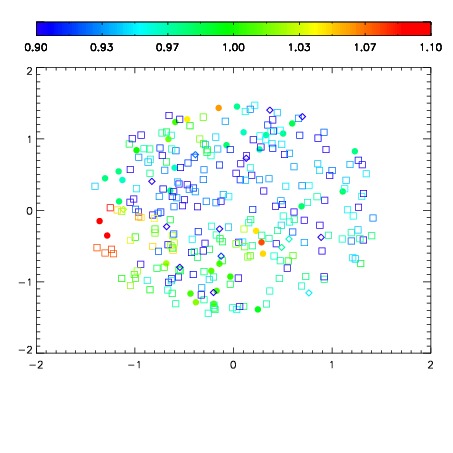
| Spatial sky telluric CO2 absorption deviations (filled: H < 10)
|
| 19410011
| 47
| | Red | Green | Blue
| | z | | 18.85
| | znorm | | 14.67
| | sky | 14.3 | 14.2 | 14.2
| | S/N | 9.3 | 16.2 | 16.7
| | S/N(c) | 21.2 | 8.0 | 31.4
| | SN(E/C) 0.42
|
| 
| 
| 
| 
| 
|
| 19410012
| 47
| | Red | Green | Blue
| | z | | 18.84
| | znorm | | 14.66
| | sky | 14.7 | 14.7 | 14.3
| | S/N | 9.6 | 16.3 | 17.4
| | S/N(c) | 20.8 | 7.9 | 30.8
| | SN(E/C) 0.40
|
| 
| 
| 
| 
| 
|
| 19410013
| 42
| | Red | Green | Blue
| | z | | 17.78
| | znorm | | 13.72
| | sky | 14.5 | 14.6 | 14.6
| | S/N | 3.4 | 7.4 | 7.6
| | S/N(c) | 9.9 | 4.4 | 16.6
| | SN(E/C) 0.75
|
| 
| 
| 
| 
| 
|
| 19410014
| 42
| | Red | Green | Blue
| | z | | 17.87
| | znorm | | 13.81
| | sky | 15.0 | 15.1 | 14.5
| | S/N | 3.9 | 8.3 | 8.1
| | S/N(c) | 10.2 | 4.5 | 17.0
| | SN(E/C) 0.70
|
| 
| 
| 
| 
| 
|
| 19410015
| 42
| | Red | Green | Blue
| | z | | 17.96
| | znorm | | 13.90
| | sky | 14.9 | 14.8 | 14.6
| | S/N | 11.5 | 19.6 | 20.7
| | S/N(c) | 11.6 | 4.9 | 18.7
| | SN(E/C) 0.60
|
| 
| 
| 
| 
| 
|
| 19410016
| 42
| | Red | Green | Blue
| | z | | 18.05
| | znorm | | 14.00
| | sky | 14.8 | 14.9 | 14.8
| | S/N | 11.4 | 19.6 | 21.0
| | S/N(c) | 12.2 | 5.1 | 19.3
| | SN(E/C) 0.59
|
| 
| 
| 
| 
| 
|
| 19410017
| 42
| | Red | Green | Blue
| | z | | 18.72
| | znorm | | 14.66
| | sky | 14.5 | 14.7 | 14.5
| | S/N | 5.8 | 11.0 | 11.0
| | S/N(c) | 19.4 | 7.6 | 29.1
| | SN(E/C) 0.45
|
| 
| 
| 
| 
| 
|
| 19410018
| 42
| | Red | Green | Blue
| | z | | 18.73
| | znorm | | 14.67
| | sky | 14.4 | 14.7 | 14.7
| | S/N | 5.0 | 9.9 | 9.7
| | S/N(c) | 19.7 | 7.7 | 29.6
| | SN(E/C) 0.45
|
| 
| 
| 
| 
| 
|
| 19410019
| 42
| | Red | Green | Blue
| | z | | 18.03
| | znorm | | 13.97
| | sky | 14.7 | 14.8 | 14.9
| | S/N | 3.8 | 7.5 | 7.6
| | S/N(c) | 11.4 | 5.0 | 18.7
| | SN(E/C) 0.66
|
| 
| 
| 
| 
| 
|
| 19410020
| 42
| | Red | Green | Blue
| | z | | 18.04
| | znorm | | 13.98
| | sky | 15.0 | 14.9 | 14.8
| | S/N | 3.3 | 7.2 | 7.3
| | S/N(c) | 11.7 | 5.0 | 19.0
| | SN(E/C) 0.59
|
| 
| 
| 
| 
| 
|