| Red | Green | Blue | |
| z | 17.64 | ||
| znorm | Inf | ||
| sky | -Inf | -Inf | -NaN |
| S/N | 14.7 | 26.8 | 28.7 |
| S/N(c) | 0.0 | 0.0 | 0.0 |
| SN(E/C) |

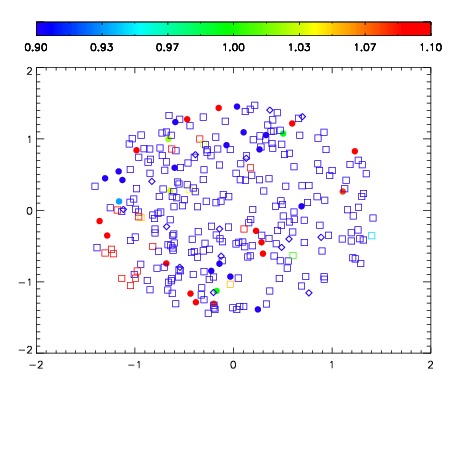


| Frame | Nreads | Zeropoints | Mag plots | Spatial mag deviation | Spatial sky 16325A emission deviations (filled: sky, open: star) | Spatial sky continuum emission | Spatial sky telluric CO2 absorption deviations (filled: H < 10) | |||||||||||||||||||||||
| 0 | 0 |
|
|
|
|
|
|
| IPAIR | NAME | SHIFT | NEWSHIFT | S/N | NAME | SHIFT | NEWSHIFT | S/N |
| 0 | 19410013 | 0.493761 | 0.00000 | 17.6630 | 19410014 | 0.000911284 | 0.492850 | 17.7444 |
| 1 | 19410012 | 0.492756 | 0.00100499 | 18.8217 | 19410011 | 0.00000 | 0.493761 | 18.8290 |
| 2 | 19410017 | 0.492770 | 0.000991017 | 18.6964 | 19410018 | 0.00116085 | 0.492600 | 18.7057 |
| 3 | 19410016 | 0.492965 | 0.000795990 | 17.9991 | 19410019 | 0.00205380 | 0.491707 | 17.9540 |
| 4 | 19410020 | 0.486908 | 0.00685301 | 17.9658 | 19410015 | 0.00126468 | 0.492496 | 17.9232 |