| Red | Green | Blue | |
| z | 17.64 | ||
| znorm | Inf | ||
| sky | -Inf | -NaN | -NaN |
| S/N | 20.1 | 40.4 | 45.4 |
| S/N(c) | 0.0 | 0.0 | 0.0 |
| SN(E/C) |
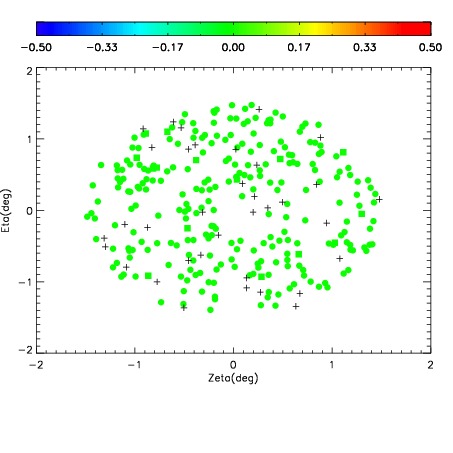
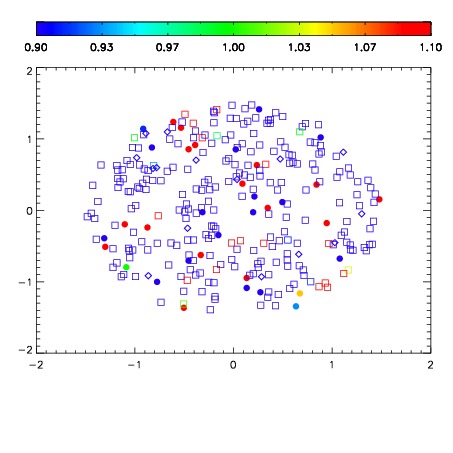


| Frame | Nreads | Zeropoints | Mag plots | Spatial mag deviation | Spatial sky 16325A emission deviations (filled: sky, open: star) | Spatial sky continuum emission | Spatial sky telluric CO2 absorption deviations (filled: H < 10) | |||||||||||||||||||||||
| 0 | 0 |
|
|
|
|
|
|
| IPAIR | NAME | SHIFT | NEWSHIFT | S/N | NAME | SHIFT | NEWSHIFT | S/N |
| 0 | 19210024 | 0.503350 | 0.00000 | 17.8694 | 19210025 | 0.000413590 | 0.502936 | 17.9050 |
| 1 | 19210027 | 0.498341 | 0.00500903 | 18.8993 | 19210026 | -0.000325238 | 0.503675 | 18.9195 |
| 2 | 19210032 | 0.501046 | 0.00230402 | 18.4676 | 19210033 | 0.00349125 | 0.499859 | 18.1988 |
| 3 | 19210028 | 0.499204 | 0.00414601 | 18.1247 | 19210029 | -0.00197901 | 0.505329 | 17.9922 |
| 4 | 19210031 | 0.500413 | 0.00293702 | 18.0791 | 19210022 | 0.00000 | 0.503350 | 17.9778 |
| 5 | 19210023 | 0.502264 | 0.00108600 | 17.9394 | 19210030 | -0.00132836 | 0.504678 | 17.9135 |
| 6 | 19210035 | 0.501429 | 0.00192100 | 17.8456 | 19210034 | 0.00345596 | 0.499894 | 17.8926 |
| 7 | 19210039 | 0.500728 | 0.00262201 | 17.5819 | 19210038 | 0.00490775 | 0.498442 | 17.7159 |
| 8 | 19210036 | 0.502960 | 0.000389993 | 17.5155 | 19210037 | 0.00557043 | 0.497780 | 17.2598 |