| Red | Green | Blue | |
| z | 17.64 | ||
| znorm | Inf | ||
| sky | -NaN | -Inf | -NaN |
| S/N | 12.1 | 24.8 | 27.8 |
| S/N(c) | 0.0 | 0.0 | 0.0 |
| SN(E/C) |
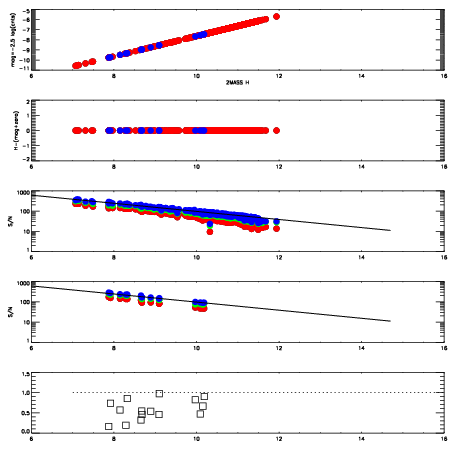
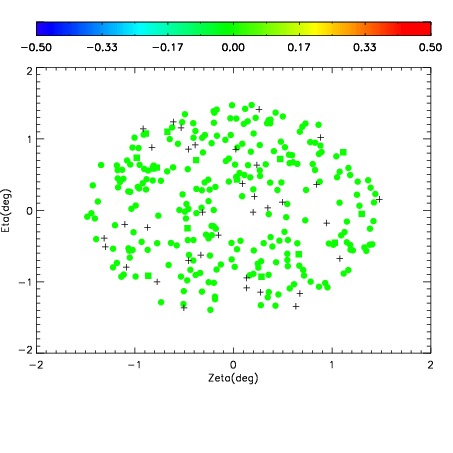
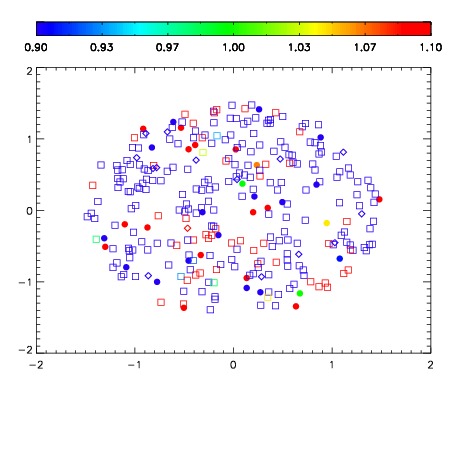
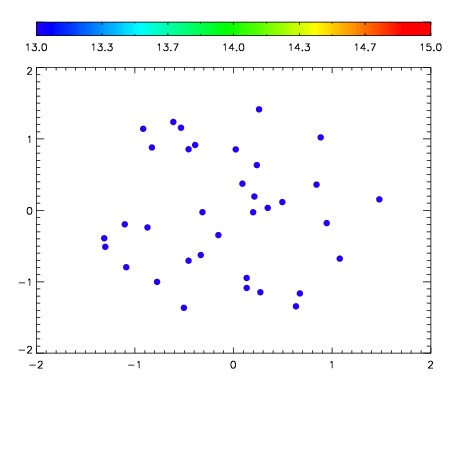

| Frame | Nreads | Zeropoints | Mag plots | Spatial mag deviation | Spatial sky 16325A emission deviations (filled: sky, open: star) | Spatial sky continuum emission | Spatial sky telluric CO2 absorption deviations (filled: H < 10) | |||||||||||||||||||||||
| 0 | 0 |
|
|
|
|
|
|
| IPAIR | NAME | SHIFT | NEWSHIFT | S/N | NAME | SHIFT | NEWSHIFT | S/N |
| 0 | 19220036 | 0.497214 | 0.00000 | 18.2596 | 19220037 | 0.00456525 | 0.492649 | 18.2119 |
| 1 | 19220035 | 0.496424 | 0.000790000 | 18.2969 | 19220034 | 0.00000 | 0.497214 | 18.3440 |
| 2 | 19220039 | 0.490982 | 0.00623199 | 18.0829 | 19220038 | 0.00487106 | 0.492343 | 17.9701 |