| Red | Green | Blue | |
| z | 17.64 | ||
| znorm | Inf | ||
| sky | -Inf | -Inf | -Inf |
| S/N | 23.8 | 41.9 | 45.4 |
| S/N(c) | 0.0 | 0.0 | 0.0 |
| SN(E/C) |
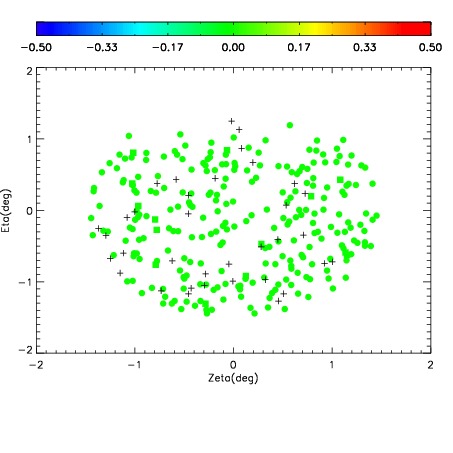
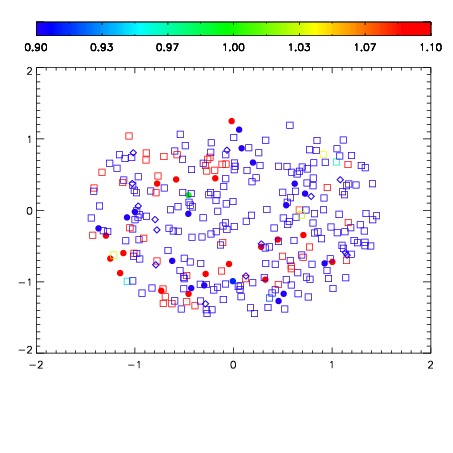


| Frame | Nreads | Zeropoints | Mag plots | Spatial mag deviation | Spatial sky 16325A emission deviations (filled: sky, open: star) | Spatial sky continuum emission | Spatial sky telluric CO2 absorption deviations (filled: H < 10) | |||||||||||||||||||||||
| 0 | 0 |
|
|
|
|
|
|
| IPAIR | NAME | SHIFT | NEWSHIFT | S/N | NAME | SHIFT | NEWSHIFT | S/N |
| 0 | 19260023 | 0.00260702 | 0.00000 | 18.0104 | 19260021 | -0.492659 | 0.495266 | 17.9619 |
| 1 | 19260024 | 0.00135696 | 0.00125006 | 18.7791 | 19260025 | -0.491449 | 0.494056 | 18.7691 |
| 2 | 19260031 | 0.00174856 | 0.000858460 | 18.5900 | 19260030 | -0.490917 | 0.493524 | 18.5730 |
| 3 | 19260028 | 0.00206631 | 0.000540710 | 18.2515 | 19260029 | -0.490615 | 0.493222 | 18.2429 |
| 4 | 19260027 | 0.000394985 | 0.00221204 | 18.1863 | 19260026 | -0.491721 | 0.494328 | 18.1986 |
| 5 | 19260020 | 0.00000 | 0.00260702 | 18.0485 | 19260022 | -0.492466 | 0.495073 | 18.0111 |