| Red | Green | Blue | |
| z | 17.64 | ||
| znorm | Inf | ||
| sky | -Inf | -Inf | -Inf |
| S/N | 19.9 | 37.4 | 39.9 |
| S/N(c) | 0.0 | 0.0 | 0.0 |
| SN(E/C) |
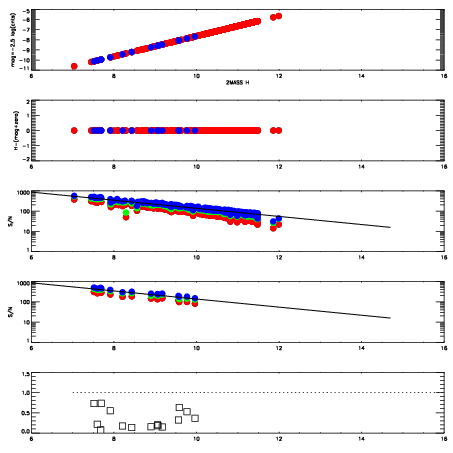
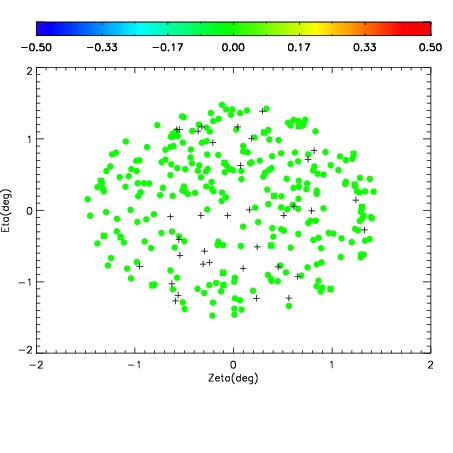
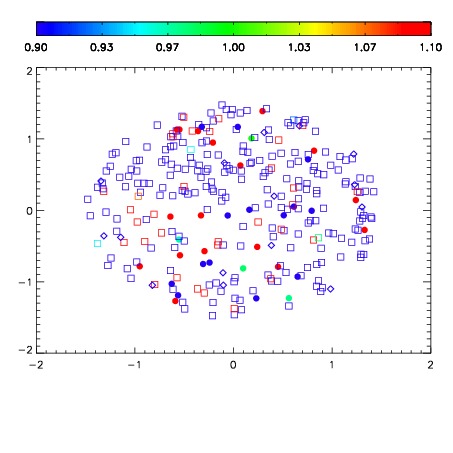


| Frame | Nreads | Zeropoints | Mag plots | Spatial mag deviation | Spatial sky 16325A emission deviations (filled: sky, open: star) | Spatial sky continuum emission | Spatial sky telluric CO2 absorption deviations (filled: H < 10) | |||||||||||||||||||||||
| 0 | 0 |
|
|
|
|
|
|
| IPAIR | NAME | SHIFT | NEWSHIFT | S/N | NAME | SHIFT | NEWSHIFT | S/N |
| 0 | 19190032 | 0.00405564 | 0.00000 | 18.2428 | 19190031 | -0.497897 | 0.501953 | 18.2273 |
| 1 | 19190033 | 0.00396477 | 9.08701e-05 | 18.5051 | 19190039 | -0.500032 | 0.504088 | 18.4836 |
| 2 | 19190040 | 0.00301060 | 0.00104504 | 18.4335 | 19190034 | -0.495733 | 0.499789 | 18.4642 |
| 3 | 19190036 | 0.00156532 | 0.00249032 | 18.4000 | 19190035 | -0.495299 | 0.499355 | 18.4370 |
| 4 | 19190029 | 0.00000 | 0.00405564 | 18.3604 | 19190038 | -0.499868 | 0.503924 | 18.3673 |
| 5 | 19190037 | 0.00244531 | 0.00161033 | 18.3101 | 19190030 | -0.498477 | 0.502533 | 18.3647 |