| Red | Green | Blue | |
| z | 17.64 | ||
| znorm | Inf | ||
| sky | -Inf | -Inf | -NaN |
| S/N | 19.2 | 34.1 | 37.2 |
| S/N(c) | 0.0 | 0.0 | 0.0 |
| SN(E/C) |


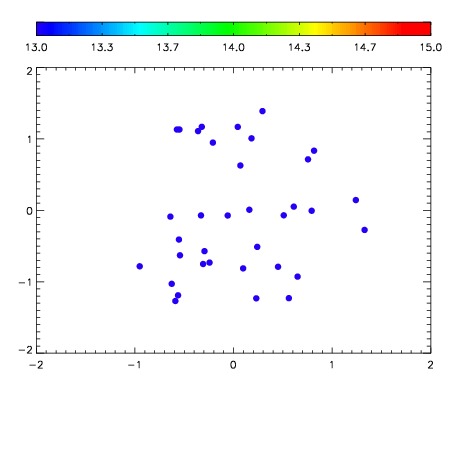

| Frame | Nreads | Zeropoints | Mag plots | Spatial mag deviation | Spatial sky 16325A emission deviations (filled: sky, open: star) | Spatial sky continuum emission | Spatial sky telluric CO2 absorption deviations (filled: H < 10) | |||||||||||||||||||||||
| 0 | 0 |
|
|
|
|
|
|
| IPAIR | NAME | SHIFT | NEWSHIFT | S/N | NAME | SHIFT | NEWSHIFT | S/N |
| 0 | 19210016 | 0.503856 | 0.00000 | 17.6673 | 19210015 | 0.00184938 | 0.502007 | 17.7569 |
| 1 | 19210012 | 0.498749 | 0.00510702 | 18.9413 | 19210011 | 0.00000 | 0.503856 | 18.9420 |
| 2 | 19210017 | 0.502999 | 0.000856996 | 18.8825 | 19210018 | 0.00151080 | 0.502345 | 18.8143 |
| 3 | 19210013 | 0.501256 | 0.00260001 | 17.4451 | 19210014 | 0.00173156 | 0.502124 | 17.4682 |