| Red | Green | Blue | |
| z | 17.64 | ||
| znorm | Inf | ||
| sky | -Inf | -Inf | -Inf |
| S/N | 9.2 | 19.2 | 19.8 |
| S/N(c) | 0.0 | 0.0 | 0.0 |
| SN(E/C) |

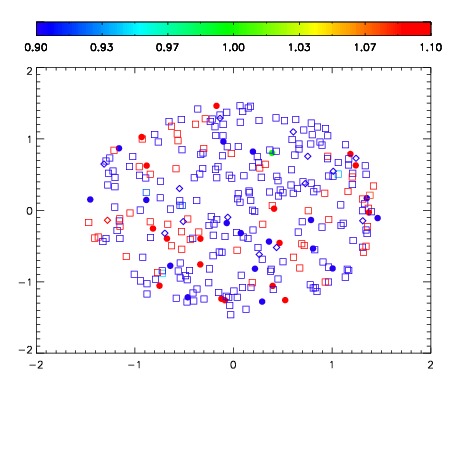
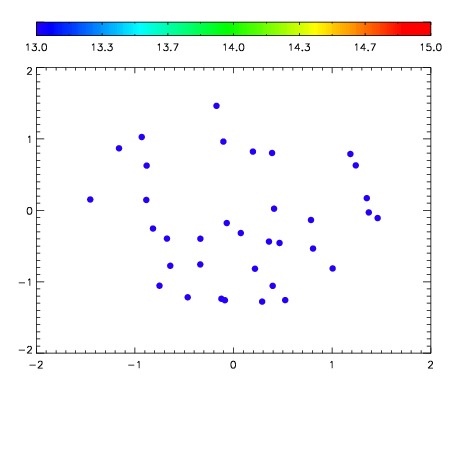

| Frame | Nreads | Zeropoints | Mag plots | Spatial mag deviation | Spatial sky 16325A emission deviations (filled: sky, open: star) | Spatial sky continuum emission | Spatial sky telluric CO2 absorption deviations (filled: H < 10) | |||||||||||||||||||||||
| 0 | 0 |
|
|
|
|
|
|
| IPAIR | NAME | SHIFT | NEWSHIFT | S/N | NAME | SHIFT | NEWSHIFT | S/N |
| 0 | 18900036 | 0.515547 | 0.00000 | 16.4282 | 18900029 | 0.00280226 | 0.512745 | 16.8691 |
| 1 | 18900028 | 0.513744 | 0.00180298 | 17.6484 | 18900026 | 0.00000 | 0.515547 | 17.8980 |
| 2 | 18900027 | 0.513027 | 0.00251997 | 17.4396 | 18900030 | 0.00245820 | 0.513089 | 17.6271 |
| 3 | 18900035 | 0.515203 | 0.000343978 | 16.7808 | 18900037 | 0.000643709 | 0.514903 | 17.5345 |
| 4 | 18900031 | 0.514282 | 0.00126499 | 16.4379 | 18900034 | 0.00336236 | 0.512185 | 17.5147 |
| 5 | 18900032 | 0.514462 | 0.00108498 | 15.9996 | 18900033 | 0.00343174 | 0.512115 | 16.3916 |