| Red | Green | Blue | |
| z | 17.64 | ||
| znorm | Inf | ||
| sky | -Inf | -Inf | -Inf |
| S/N | 20.2 | 39.1 | 41.4 |
| S/N(c) | 0.0 | 0.0 | 0.0 |
| SN(E/C) |
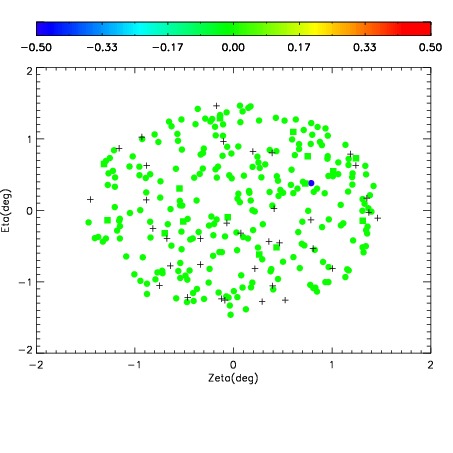
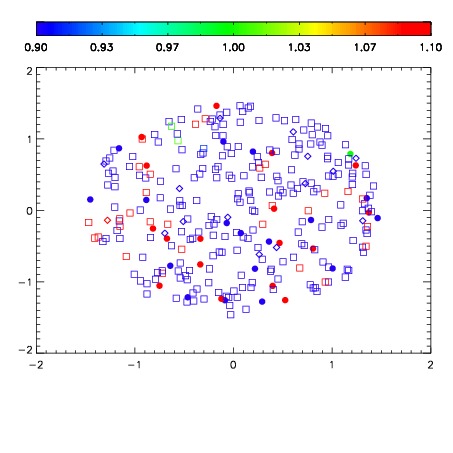
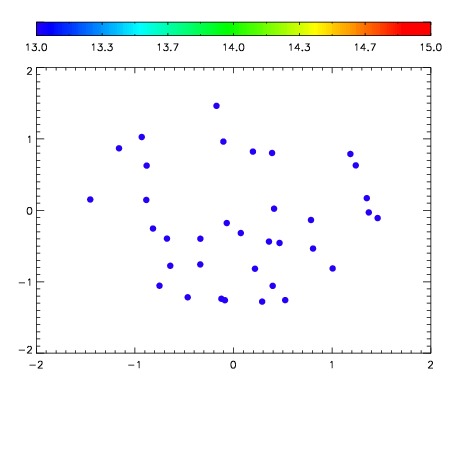

| Frame | Nreads | Zeropoints | Mag plots | Spatial mag deviation | Spatial sky 16325A emission deviations (filled: sky, open: star) | Spatial sky continuum emission | Spatial sky telluric CO2 absorption deviations (filled: H < 10) | |||||||||||||||||||||||
| 0 | 0 |
|
|
|
|
|
|
| IPAIR | NAME | SHIFT | NEWSHIFT | S/N | NAME | SHIFT | NEWSHIFT | S/N |
| 0 | 18960052 | 0.518402 | 0.00000 | 18.4659 | 18960054 | 0.00324550 | 0.515157 | 18.5486 |
| 1 | 18960043 | 0.511059 | 0.00734299 | 18.7283 | 18960042 | 0.00539470 | 0.513007 | 18.5771 |
| 2 | 18960055 | 0.516949 | 0.00145298 | 18.5581 | 18960053 | 0.00449491 | 0.513907 | 18.5548 |
| 3 | 18960048 | 0.514933 | 0.00346899 | 18.4442 | 18960049 | 0.00533616 | 0.513066 | 18.3800 |
| 4 | 18960039 | 0.512383 | 0.00601900 | 18.3910 | 18960038 | 0.00000 | 0.518402 | 18.3530 |
| 5 | 18960047 | 0.515173 | 0.00322896 | 18.3323 | 18960046 | 0.00812260 | 0.510279 | 18.3139 |
| 6 | 18960051 | 0.517192 | 0.00120997 | 18.2113 | 18960050 | 0.00542329 | 0.512979 | 18.2195 |
| 7 | 18960040 | 0.513373 | 0.00502896 | 18.1162 | 18960041 | 0.00693818 | 0.511464 | 18.1465 |
| 8 | 18960044 | 0.513410 | 0.00499201 | 17.9567 | 18960045 | 0.00676690 | 0.511635 | 18.0614 |