| Red | Green | Blue | |
| z | 17.64 | ||
| znorm | Inf | ||
| sky | -Inf | -Inf | -Inf |
| S/N | 13.1 | 22.8 | 27.8 |
| S/N(c) | 0.0 | 0.0 | 0.0 |
| SN(E/C) |
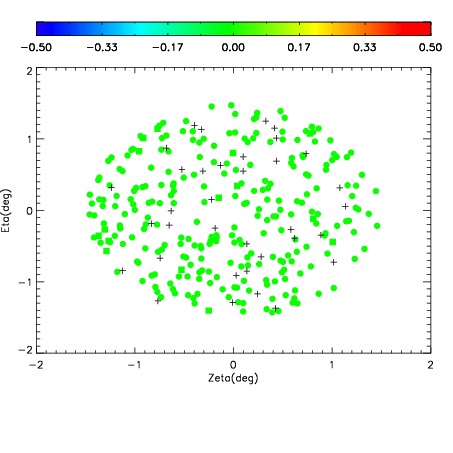
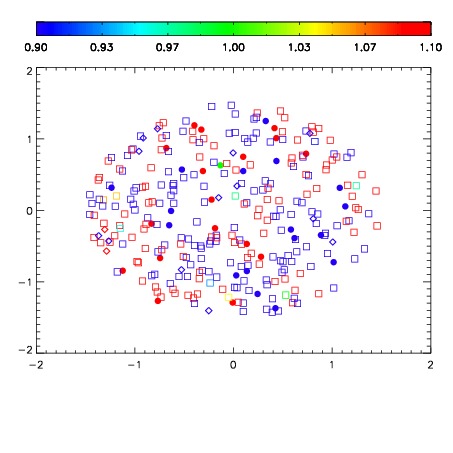
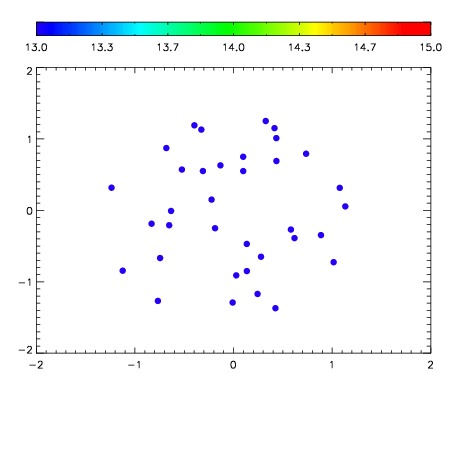

| Frame | Nreads | Zeropoints | Mag plots | Spatial mag deviation | Spatial sky 16325A emission deviations (filled: sky, open: star) | Spatial sky continuum emission | Spatial sky telluric CO2 absorption deviations (filled: H < 10) | |||||||||||||||||||||||
| 0 | 0 |
|
|
|
|
|
|
| IPAIR | NAME | SHIFT | NEWSHIFT | S/N | NAME | SHIFT | NEWSHIFT | S/N |
| 0 | 19860017 | 0.499223 | 0.00000 | 17.7417 | 19860012 | 0.00000 | 0.499223 | 17.4320 |
| 1 | 19860014 | 0.497400 | 0.00182301 | 17.9728 | 19860015 | -0.00749076 | 0.506714 | 18.3169 |
| 2 | 19860013 | 0.495529 | 0.00369400 | 17.7769 | 19860016 | -0.00757437 | 0.506797 | 17.6576 |