| Red | Green | Blue | |
| z | 17.64 | ||
| znorm | Inf | ||
| sky | -Inf | -Inf | -Inf |
| S/N | 24.9 | 48.7 | 58.6 |
| S/N(c) | 0.0 | 0.0 | 0.0 |
| SN(E/C) |
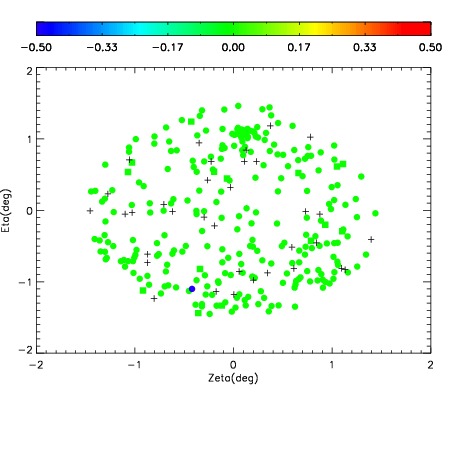
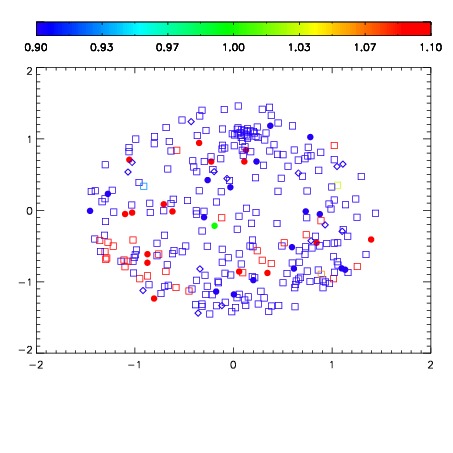


| Frame | Nreads | Zeropoints | Mag plots | Spatial mag deviation | Spatial sky 16325A emission deviations (filled: sky, open: star) | Spatial sky continuum emission | Spatial sky telluric CO2 absorption deviations (filled: H < 10) | |||||||||||||||||||||||
| 0 | 0 |
|
|
|
|
|
|
| IPAIR | NAME | SHIFT | NEWSHIFT | S/N | NAME | SHIFT | NEWSHIFT | S/N |
| 0 | 18920012 | 0.508393 | 0.00000 | 18.1677 | 18920013 | -0.000533161 | 0.508926 | 18.2142 |
| 1 | 18920016 | 0.504829 | 0.00356400 | 18.4642 | 18920017 | -0.00292426 | 0.511317 | 18.4956 |
| 2 | 18920023 | 0.500785 | 0.00760800 | 18.4268 | 18920022 | -0.00525267 | 0.513646 | 18.4500 |
| 3 | 18920019 | 0.501939 | 0.00645399 | 18.3568 | 18920014 | -0.00171976 | 0.510113 | 18.4499 |
| 4 | 18920020 | 0.501729 | 0.00666398 | 18.3533 | 18920025 | -0.00651121 | 0.514904 | 18.3720 |
| 5 | 18920015 | 0.504769 | 0.00362396 | 18.3178 | 18920018 | -0.00332974 | 0.511723 | 18.3067 |
| 6 | 18920024 | 0.501559 | 0.00683397 | 18.2655 | 18920021 | -0.00482750 | 0.513220 | 18.2880 |
| 7 | 18920011 | 0.507483 | 0.000909984 | 18.2414 | 18920010 | 0.00000 | 0.508393 | 18.2184 |
| 8 | 18920027 | 0.500315 | 0.00807798 | 17.8107 | 18920026 | -0.00613546 | 0.514528 | 18.0762 |