| Red | Green | Blue | |
| z | 17.64 | ||
| znorm | Inf | ||
| sky | -Inf | -Inf | -Inf |
| S/N | 30.7 | 50.2 | 58.4 |
| S/N(c) | 16.7 | 42.4 | 49.5 |
| SN(E/C) |
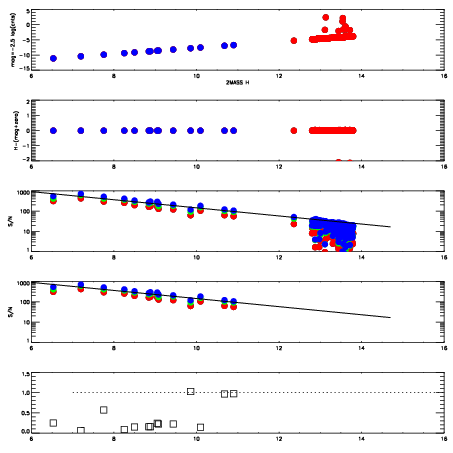
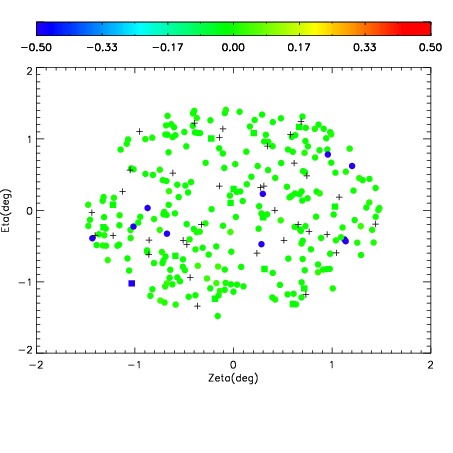
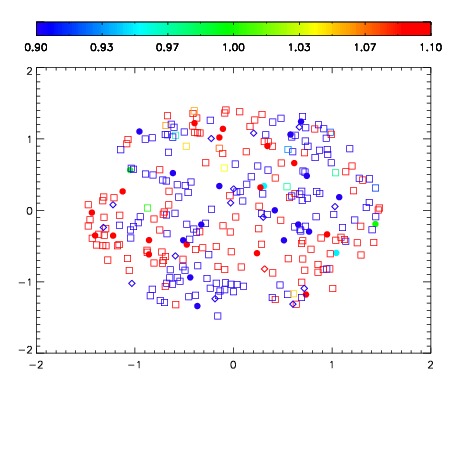
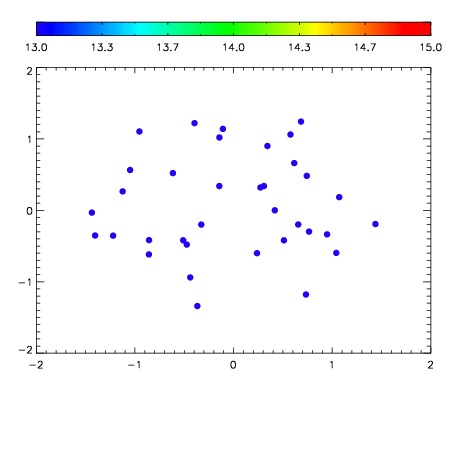

| Frame | Nreads | Zeropoints | Mag plots | Spatial mag deviation | Spatial sky 16325A emission deviations (filled: sky, open: star) | Spatial sky continuum emission | Spatial sky telluric CO2 absorption deviations (filled: H < 10) | |||||||||||||||||||||||
| 0 | 0 |
|
|
|
|
|
|
| IPAIR | NAME | SHIFT | NEWSHIFT | S/N | NAME | SHIFT | NEWSHIFT | S/N |
| 0 | 19110021 | 0.504431 | 0.00000 | 18.2179 | 19110022 | 0.000893765 | 0.503537 | 18.3436 |
| 1 | 19110013 | 0.503399 | 0.00103199 | 18.7521 | 19110014 | -0.000609404 | 0.505040 | 18.7614 |
| 2 | 19110012 | 0.503444 | 0.000986993 | 18.7311 | 19110015 | -0.000789101 | 0.505220 | 18.6983 |
| 3 | 19110017 | 0.503296 | 0.00113499 | 18.4951 | 19110011 | 0.00000 | 0.504431 | 18.6569 |
| 4 | 19110016 | 0.502985 | 0.00144601 | 18.4828 | 19110019 | -0.000751017 | 0.505182 | 18.3594 |
| 5 | 19110020 | 0.503973 | 0.000458002 | 18.1669 | 19110018 | -0.000263232 | 0.504694 | 18.2688 |