| Red | Green | Blue | |
| z | 17.65 | ||
| znorm | Inf | ||
| sky | -Inf | -Inf | -NaN |
| S/N | 25.2 | 41.1 | 49.2 |
| S/N(c) | 18.7 | 45.6 | 57.7 |
| SN(E/C) |
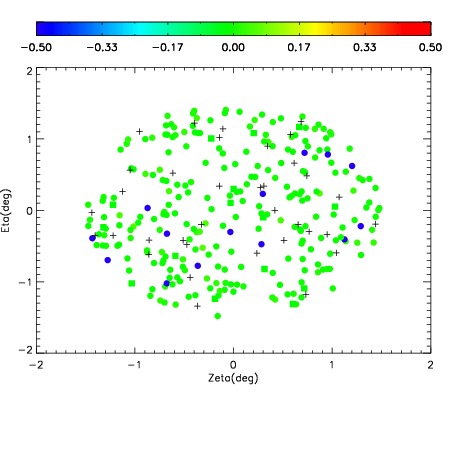
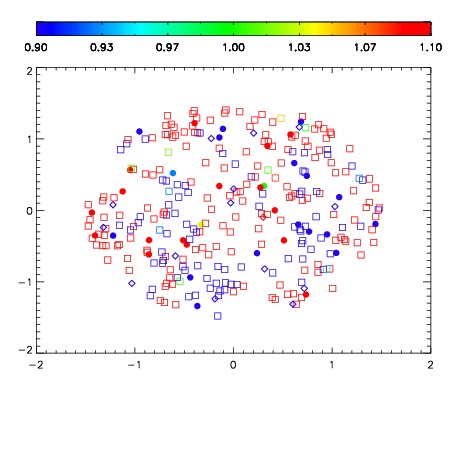
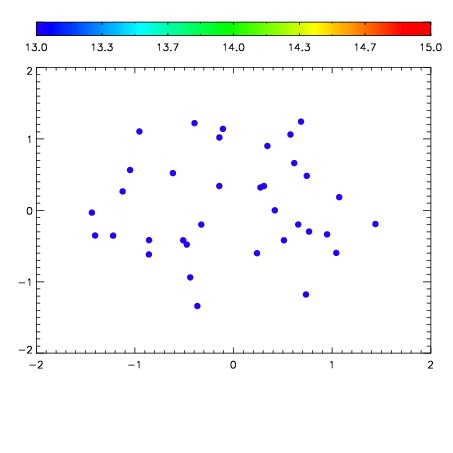

| Frame | Nreads | Zeropoints | Mag plots | Spatial mag deviation | Spatial sky 16325A emission deviations (filled: sky, open: star) | Spatial sky continuum emission | Spatial sky telluric CO2 absorption deviations (filled: H < 10) | |||||||||||||||||||||||
| 0 | 0 |
|
|
|
|
|
|
| IPAIR | NAME | SHIFT | NEWSHIFT | S/N | NAME | SHIFT | NEWSHIFT | S/N |
| 0 | 19360020 | 0.00209068 | 0.00000 | 18.9967 | 19360021 | -0.484853 | 0.486944 | 18.9669 |
| 1 | 19360023 | 0.00124262 | 0.000848060 | 18.9942 | 19360022 | -0.484852 | 0.486943 | 18.9478 |
| 2 | 19360019 | 0.00139627 | 0.000694410 | 18.9294 | 19360017 | -0.488116 | 0.490207 | 18.9198 |
| 3 | 19360016 | 0.00000 | 0.00209068 | 18.8103 | 19360018 | -0.488085 | 0.490176 | 18.9109 |