| Red | Green | Blue | |
| z | 17.64 | ||
| znorm | Inf | ||
| sky | -Inf | -Inf | -NaN |
| S/N | 31.7 | 48.8 | 58.6 |
| S/N(c) | 0.0 | 0.0 | 0.0 |
| SN(E/C) |
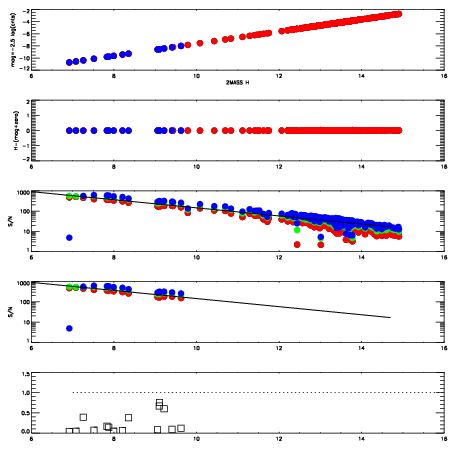
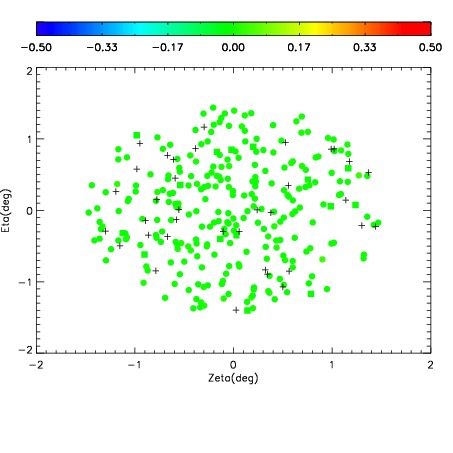

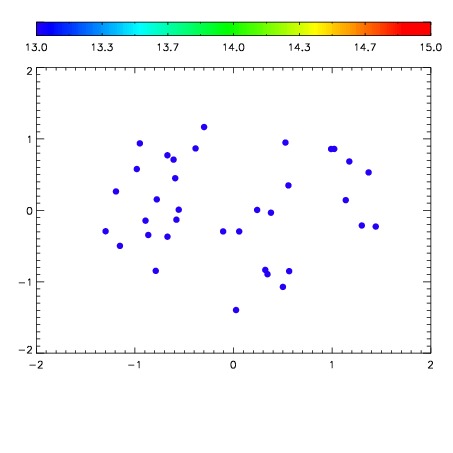

| Frame | Nreads | Zeropoints | Mag plots | Spatial mag deviation | Spatial sky 16325A emission deviations (filled: sky, open: star) | Spatial sky continuum emission | Spatial sky telluric CO2 absorption deviations (filled: H < 10) | |||||||||||||||||||||||
| 0 | 0 |
|
|
|
|
|
|
| IPAIR | NAME | SHIFT | NEWSHIFT | S/N | NAME | SHIFT | NEWSHIFT | S/N |
| 0 | 19020053 | 0.500446 | 0.00000 | 19.8507 | 19020055 | 0.00108236 | 0.499364 | 19.8991 |
| 1 | 19020056 | 0.497798 | 0.00264803 | 19.8622 | 19020054 | 0.00113927 | 0.499307 | 19.9022 |
| 2 | 19020052 | 0.499619 | 0.000827014 | 19.7552 | 19020051 | 0.00000 | 0.500446 | 19.8007 |