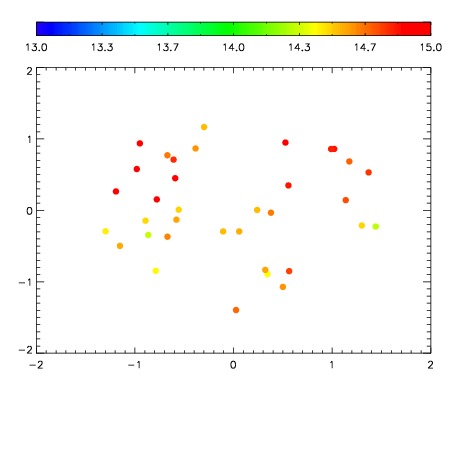
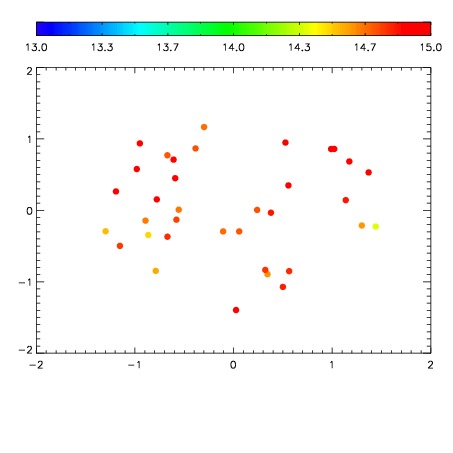
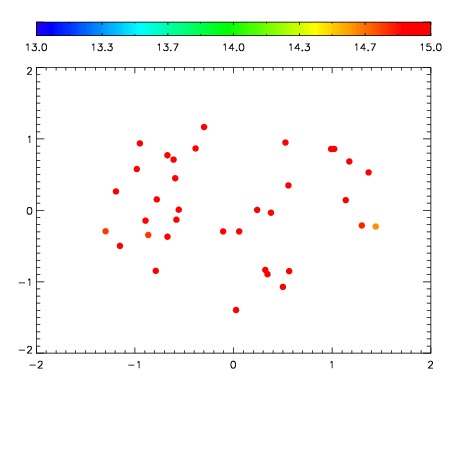
| Frame | Nreads | Zeropoints | Mag plots
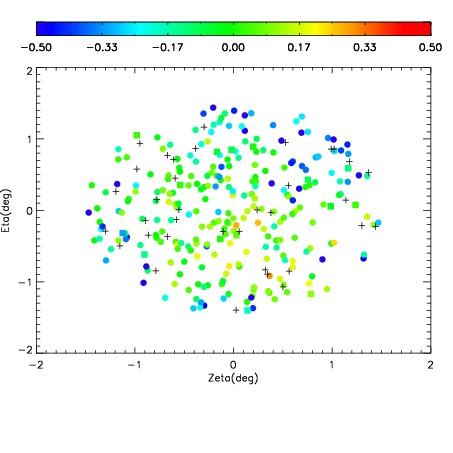
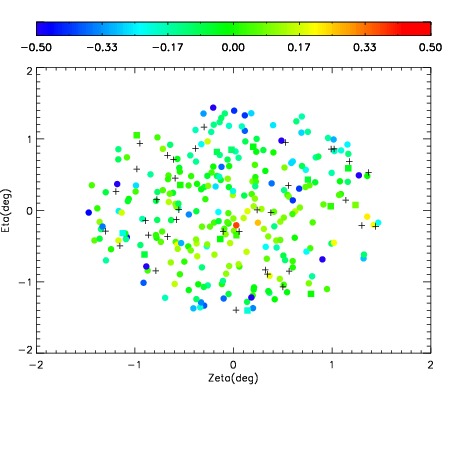
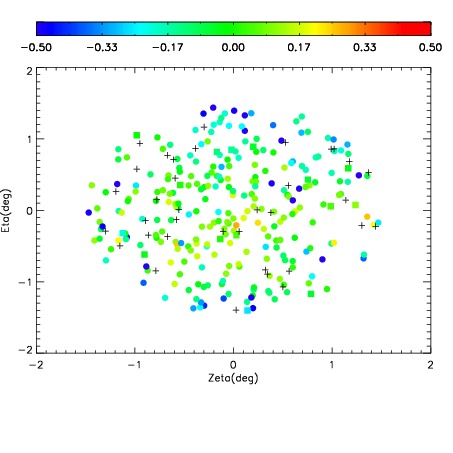
| Spatial mag deviation
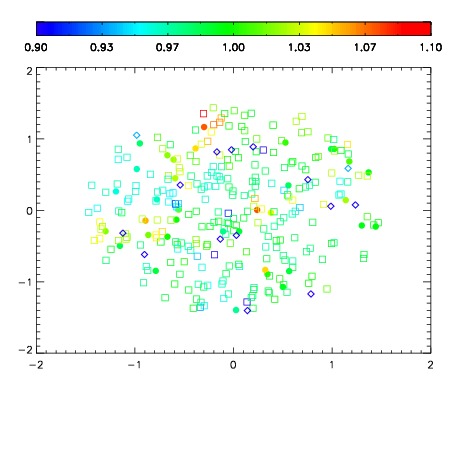
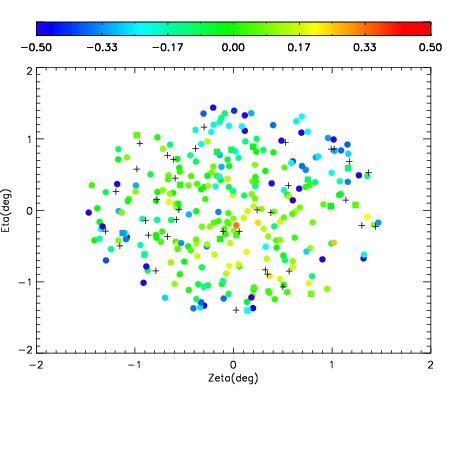
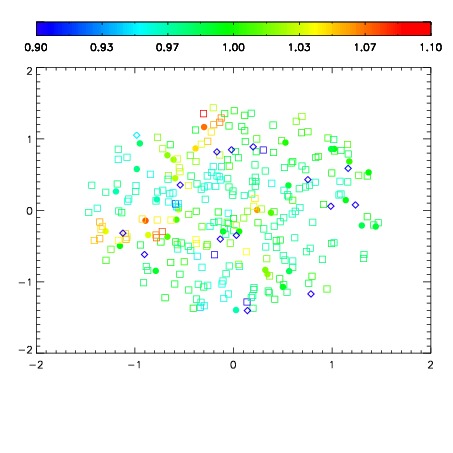
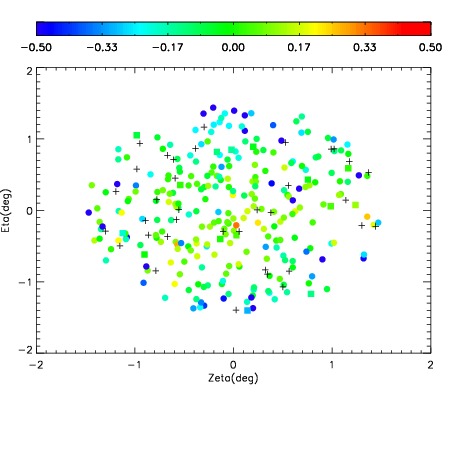
| Spatial sky 16325A emission deviations (filled: sky, open: star)
| Spatial sky continuum emission
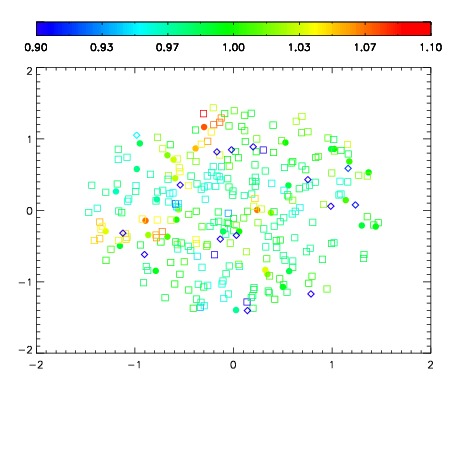
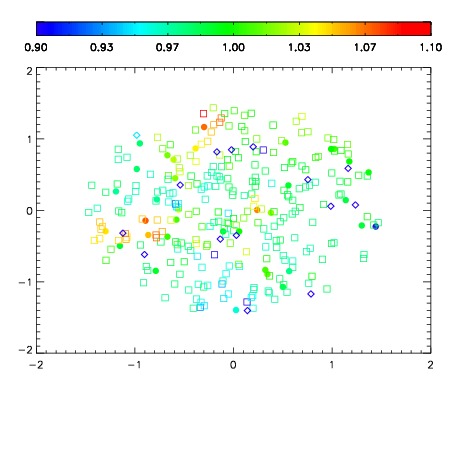
| Spatial sky telluric CO2 absorption deviations (filled: H < 10)
|
| 19090053
| 94
| | Red | Green | Blue
| | z | | 19.62
| | znorm | | 14.69
| | sky | 15.3 | 14.6 | 14.8
| | S/N | 21.0 | 30.5 | 36.5
| | S/N(c) | 30.0 | 107.5 | 13.0
| | SN(E/C) 0.16
|
| 
| 
| 
| 
| 
|
| 19090054
| 94
| | Red | Green | Blue
| | z | | 19.63
| | znorm | | 14.70
| | sky | 15.2 | 14.8 | 14.8
| | S/N | 20.8 | 30.3 | 36.4
| | S/N(c) | 30.5 | 107.3 | 15.3
| | SN(E/C) 0.16
|
| 
| 
| 
| 
| 
|
| 19090055
| 94
| | Red | Green | Blue
| | z | | 19.53
| | znorm | | 14.60
| | sky | 15.4 | 15.0 | 14.8
| | S/N | 19.6 | 29.0 | 34.6
| | S/N(c) | 28.6 | 100.3 | 14.6
| | SN(E/C) 0.17
|
| 
| 
| 
| 
| 
|
| 19090056
| 94
| | Red | Green | Blue
| | z | | 19.05
| | znorm | | 14.11
| | sky | 15.4 | 15.0 | 14.9
| | S/N | 15.7 | 23.2 | 27.1
| | S/N(c) | 22.2 | 78.2 | 11.3
| | SN(E/C) 0.23
|
| 
| 
| 
| 
| 
|
| 19090057
| 94
| | Red | Green | Blue
| | z | | 19.34
| | znorm | | 14.40
| | sky | 15.4 | 15.1 | 15.0
| | S/N | 17.4 | 26.0 | 30.7
| | S/N(c) | 25.0 | 87.8 | 12.8
| | SN(E/C) 0.20
|
| 
| 
| 
| 
| 
|
| 19090058
| 94
| | Red | Green | Blue
| | z | | 19.49
| | znorm | | 14.56
| | sky | 15.4 | 15.1 | 14.9
| | S/N | 19.1 | 27.7 | 32.9
| | S/N(c) | 25.8 | 91.0 | 13.2
| | SN(E/C) 0.19
|
| 
| 
| 
| 
| 
|