| Red | Green | Blue | |
| z | 17.64 | ||
| znorm | Inf | ||
| sky | -NaN | -NaN | -NaN |
| S/N | 28.9 | 43.4 | 54.3 |
| S/N(c) | 39.2 | 136.7 | 20.5 |
| SN(E/C) |


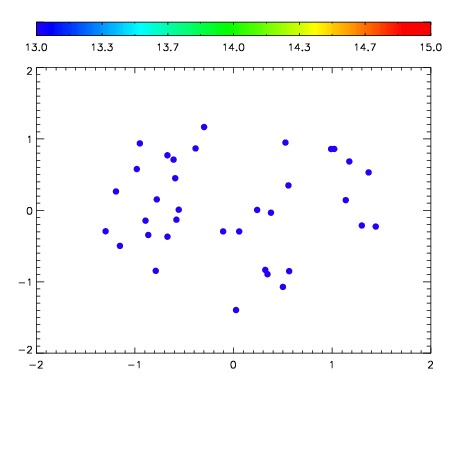

| Frame | Nreads | Zeropoints | Mag plots | Spatial mag deviation | Spatial sky 16325A emission deviations (filled: sky, open: star) | Spatial sky continuum emission | Spatial sky telluric CO2 absorption deviations (filled: H < 10) | |||||||||||||||||||||||
| 0 | 0 |
|
|
|
|
|
|
| IPAIR | NAME | SHIFT | NEWSHIFT | S/N | NAME | SHIFT | NEWSHIFT | S/N |
| 0 | 19090055 | 0.508313 | 0.00000 | 19.5171 | 19090057 | 0.00131754 | 0.506995 | 19.3133 |
| 1 | 19090054 | 0.507806 | 0.000506997 | 19.6292 | 19090053 | 0.00000 | 0.508313 | 19.6510 |
| 2 | 19090058 | 0.508181 | 0.000132024 | 19.4667 | 19090056 | 0.00190369 | 0.506409 | 19.0403 |