| Red | Green | Blue | |
| z | 17.64 | ||
| znorm | Inf | ||
| sky | -NaN | -Inf | -NaN |
| S/N | 26.0 | 39.2 | 48.5 |
| S/N(c) | 6.7 | 32.1 | 99.0 |
| SN(E/C) |
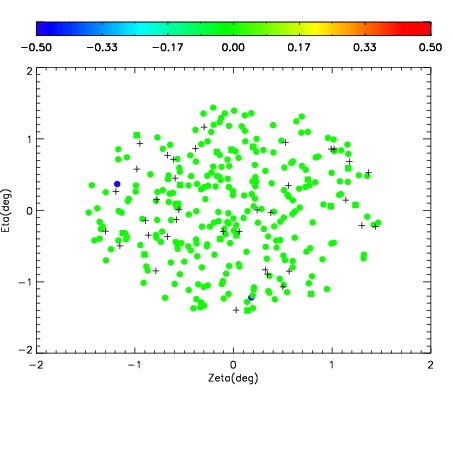

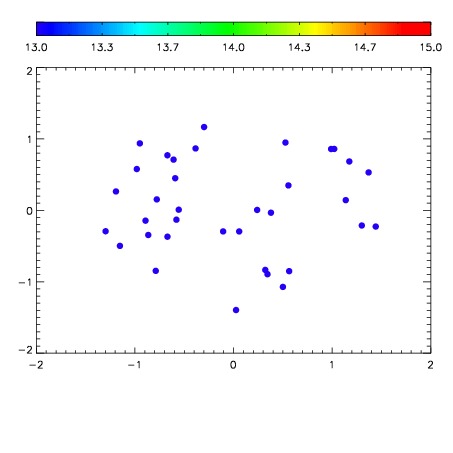

| Frame | Nreads | Zeropoints | Mag plots | Spatial mag deviation | Spatial sky 16325A emission deviations (filled: sky, open: star) | Spatial sky continuum emission | Spatial sky telluric CO2 absorption deviations (filled: H < 10) | |||||||||||||||||||||||
| 0 | 0 |
|
|
|
|
|
|
| IPAIR | NAME | SHIFT | NEWSHIFT | S/N | NAME | SHIFT | NEWSHIFT | S/N |
| 0 | 19120052 | 0.00186408 | 0.00000 | 19.4408 | 19120050 | -0.494073 | 0.495937 | 19.3585 |
| 1 | 19120049 | 0.00000 | 0.00186408 | 19.4548 | 19120051 | -0.494782 | 0.496646 | 19.5824 |