| Frame | Nreads | Zeropoints | Mag plots
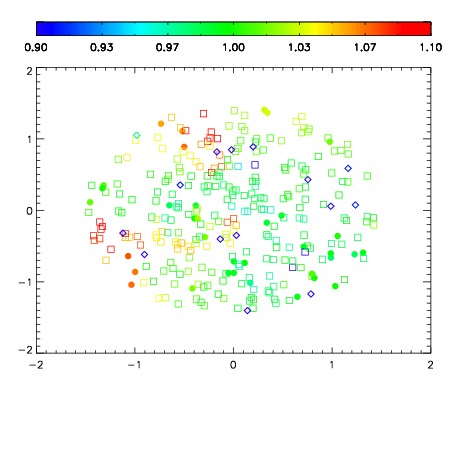
| Spatial mag deviation
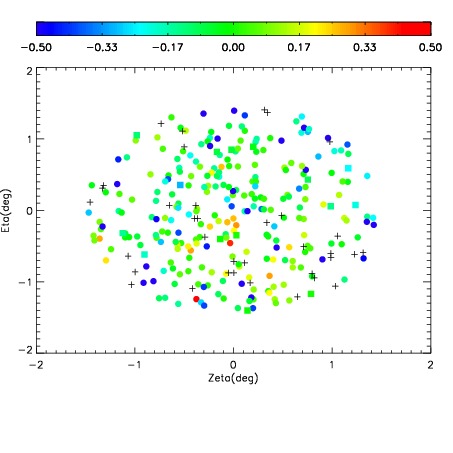
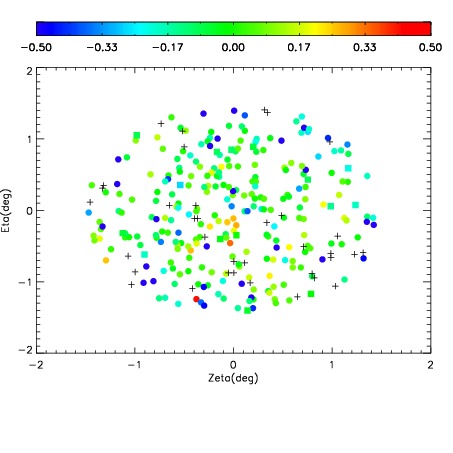
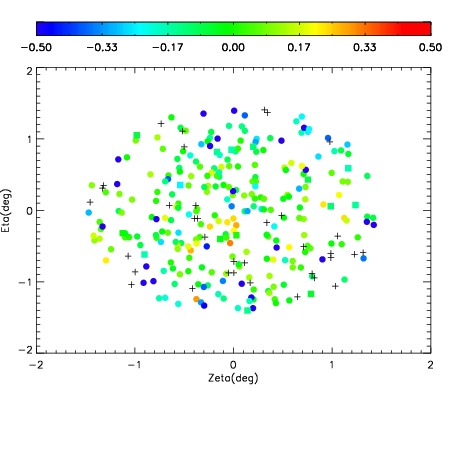
| Spatial sky 16325A emission deviations (filled: sky, open: star)
| Spatial sky continuum emission
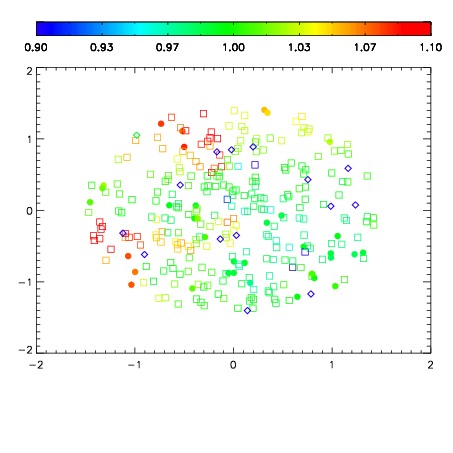
| Spatial sky telluric CO2 absorption deviations (filled: H < 10)
|
| 19070047
| 94
| | Red | Green | Blue
| | z | | 19.85
| | znorm | | 14.91
| | sky | 14.9 | 14.5 | 14.8
| | S/N | 29.3 | 41.1 | 49.1
| | S/N(c) | 50.5 | 11.0 | 37.5
| | SN(E/C) 0.16
|
| 
| 
| 
| 
| 
|
| 19070048
| 94
| | Red | Green | Blue
| | z | | 19.90
| | znorm | | 14.96
| | sky | 15.1 | 14.8 | 14.7
| | S/N | 29.3 | 42.6 | 50.4
| | S/N(c) | 52.4 | 11.4 | 37.8
| | SN(E/C) 0.15
|
| 
| 
| 
| 
| 
|
| 19070049
| 94
| | Red | Green | Blue
| | z | | 19.87
| | znorm | | 14.94
| | sky | 15.0 | 14.8 | 14.8
| | S/N | 28.6 | 41.8 | 49.2
| | S/N(c) | 51.7 | 11.3 | 37.0
| | SN(E/C) 0.13
|
| 
| 
| 
| 
| 
|
| 19070050
| 94
| | Red | Green | Blue
| | z | | 19.84
| | znorm | | 14.90
| | sky | 15.1 | 14.9 | 14.8
| | S/N | 28.3 | 41.2 | 48.6
| | S/N(c) | 50.9 | 11.1 | 36.2
| | SN(E/C) 0.16
|
| 
| 
| 
| 
| 
|